
In the first week of October, the price of Bitcoin (BTC) has surpassed a long-term falling trendline that dates back to April, 2022. As of October 6, Bitcoin is trading past the $20,100 mark.
Now that the price is trading outside the falling trendline, many traders obviously feel gleeful, but are any of the relevant indicators and metrics truly showing signs that warrant a bullish stance on Bitcoin? After all, the value of BTC simply contracted its way through the aforementioned trendline by moving in a sideways pattern between the price ranges of around $18,500 and $24,500 for the past 114 days.
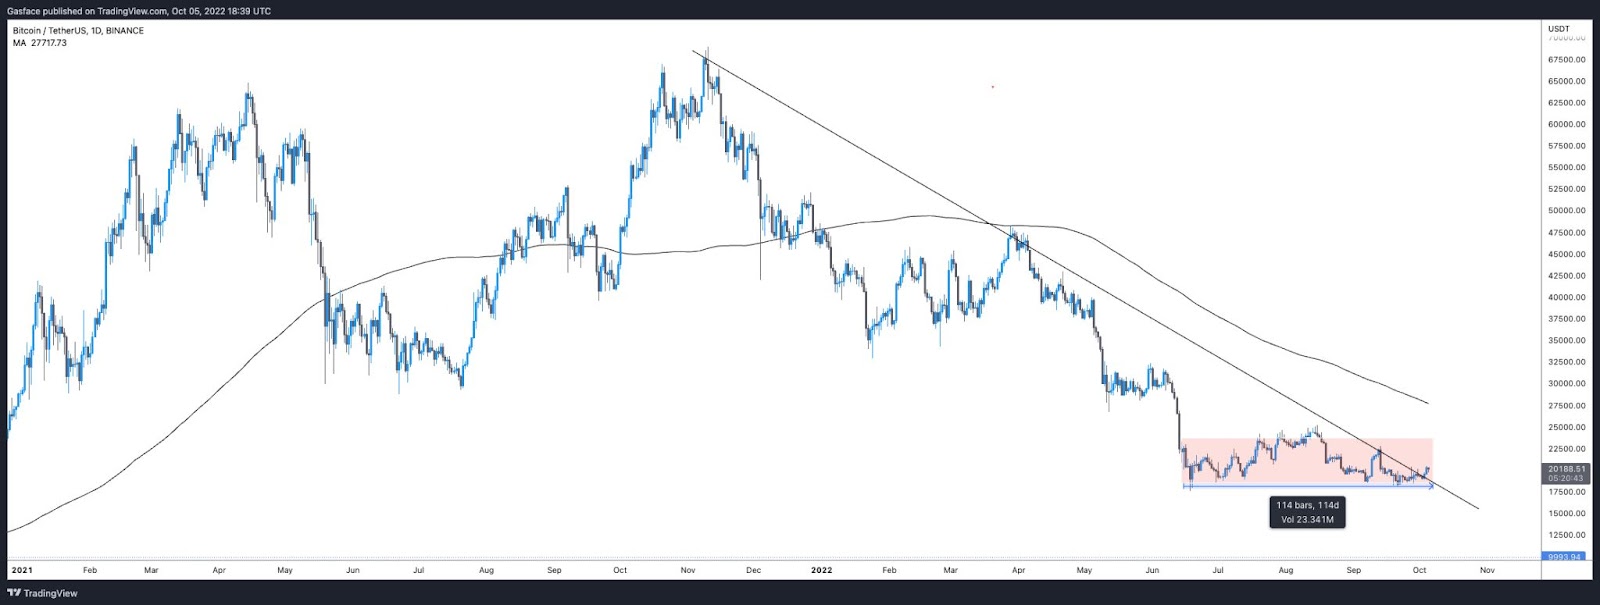
Source: (TradingView/ BTC/USDT price chart)
The direction in which both Bitcoin and Ether (ETH) move tends to follow that of the equities, and BTC’s recent rise to $20,300 on October 4 likewise coincided with increases of 2% to 3% for the Dow, S&P 500, and Nasdaq.

Source: (CoinMetrics/ BTC,ETH, and S&P 500 correlations)
With global inflation still high, no recent developments encourage investors to take on more risk. Since Bitcoin is already sensitive to change in the equities markets and in general unfavorable economic news and rumors, it does not seem very likely that Bitcoin breaking through the dipping trendline signals an immediate reverse in market trend. However, a break through the $25,000 mark may be enough of a positive sign for traders to go bullish.