
Traders noticed a downward trend on the crypto market price chart in the late hours of March 14, leading to a small crypto price correction in the market.
Bitcoin shed a little loss over the last 24 hours, dropping from its all-time at $73,737. As a result, a downward trend line appeared in the crypto market price chart, indicating a dip. On a positive note, the crypto price correction was only to a certain extent. BTC has already reclaimed the $68,000 trading level, sending a likely recovery signal for the weekend.
Crypto liquidations also increased during the crypto price correction, of which most were long positions. The decline in token prices also led to the overall crypto market cap declining minimally. But even amidst the uncertain movements, institutional investors are upbeat on the crypto market.
Leading BTC proponent MicroStrategy announced a fundraising measure earlier this week. It informed that the fundraise was to fund the eventual acquisition of more Bitcoin. Its co-founder,
Michael Saylor, equated Bitcoin to digital property and said it would conserve value for ages. He praised BTC and said, “It’s global; it’s the most widely recognized and trusted investment asset in the world right now. It’s ethical because it’s the king of all commodities because there’s no issuer, [and] there’s no company controlling it.”
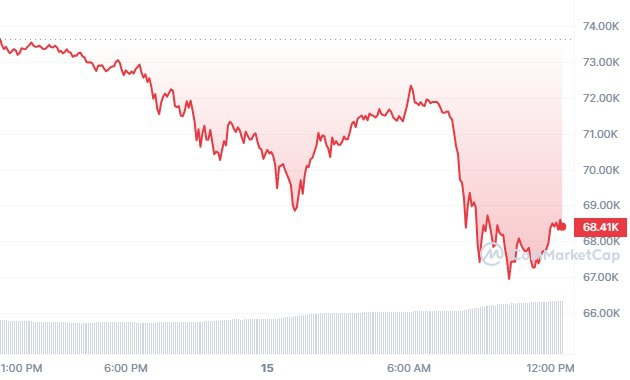
BTC/USD 1D price chart
Bitcoin is currently trading at around $68,400 on March 15, 2024, with BTC/USD trading lower by a margin of 6.4% in the last 24 hours. Bitcoin’s market cap was trading at around $ 1.35 trillion in the last 24 hours.
BTC/USD is trading higher than its 20-day EMA (62,118.98), as BTC’s 24-hour volume was at around $76 billion. The global crypto market cap decreased by around 5.32%, trading above $2.62 trillion. BTC’s year-to-date returns are at 63.02%.
The crypto market fundamentals look robust, creating a good opportunity to trade crypto! Join Millionero and start today!