
The crypto price trajectory saw a steep upward move on May 13, mainly led by Bitcoin’s price breakout from its $61,000 resistance, while other altcoins also displayed better indicators.
The price levels of Bitcoin are back to its previous week’s high, which was above $62,000. After two days of trading below the level, its price jumped on May 13, hiking the crypto price trajectory. In the next few days, it could be crucial for Bitcoin to hold its support to lead the next rally. Meanwhile, there have been interesting observations regarding Bitcoin wallets having substantial holdings.
A block explorer revealed how two Bitcoin wallets transferred 500 BTC each after a decade of dormancy. The sudden activity in these wallets may indicate signs of an incoming spike of volatility in the market. Moreover, Bitcoin’s distance from the $60,000 mark is a good sign for its further price jumps. Bears have been active at $60,000, and sudden declines may have been possible there.
In another sign of bullish sentiments, financial services firms like JP Morgan reported they bought shares of the spot Bitcoin ETFs. Other firms like Wells Fargo have also reported the same.
Analysts and experts will likely continue to observe whether Bitcoin breaks away from its range-bound motion this week. If it does, an upward move to $65,000 is possible, which could also improve the market’s prospects.
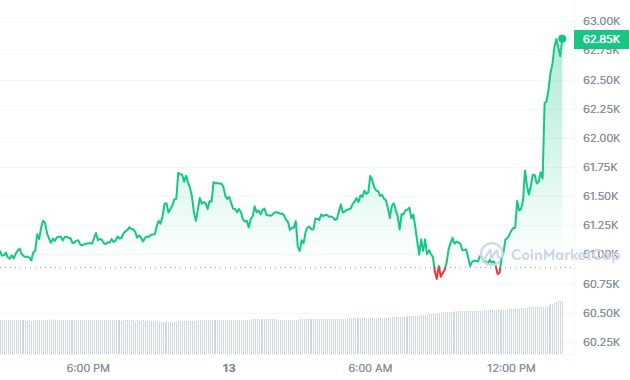
BTC/USD 1D price chart
Bitcoin is currently trading at around $62,800 on May 13, 2024, with BTC/USD trading higher by a margin of 2.96% in the last 24 hours. Bitcoin’s market cap was trading at around $ 1.24 trillion in the last 24 hours.
BTC/USD is trading above its 20-day EMA (62,648.14), as BTC’s 24-hour volume was at around $21 billion. The global crypto market cap increased by around 2.23%, trading above $2.3 trillion. BTC’s year-to-date returns are at 49.93%.
Join Millionero and start trading and investing in the bullish crypto market!