
The upward momentum continued to help the overall crypto outlook get better, while Bitcoin trading indicators got to its best positions in the last few weeks.
After facing risks of going below $50,000 just a fortnight ago, Bitcoin has staged a comeback story. It has risen steeply in the last two weeks and almost touched $65,000 in the early hours of July 16. Bitcoin trading indicators have also improved, helping fuel the rally. As a result, the crypto outlook looks in its best shape currently, compared to the last two weeks.
A range of factors could have aided BTC in its recovery. First, the sell-offs of crypto among institutional investors did not affect the market as much. Hence, the panic anticipating the selling pressures has likely subsided. Second, the news of ether ETFs has helped the broader crypto market. Traders and investors are expecting a roll-out this month.
Experts in financial services have also tilted their opinions in Bitcoin’s favor. For instance, Larry Fink from the world’s biggest investment management firm, BlackRock, said, “It is a legitimate financial instrument that allows you to maybe have uncorrelated types of returns.” He also described BTC as ‘digital gold.’ Thus, the current market rally has turned the tide in its favor due to its continuous resilience.
Bitcoin seems to have comfortably consolidated over $60,000. A dip below the mark could be unlikely within this week.
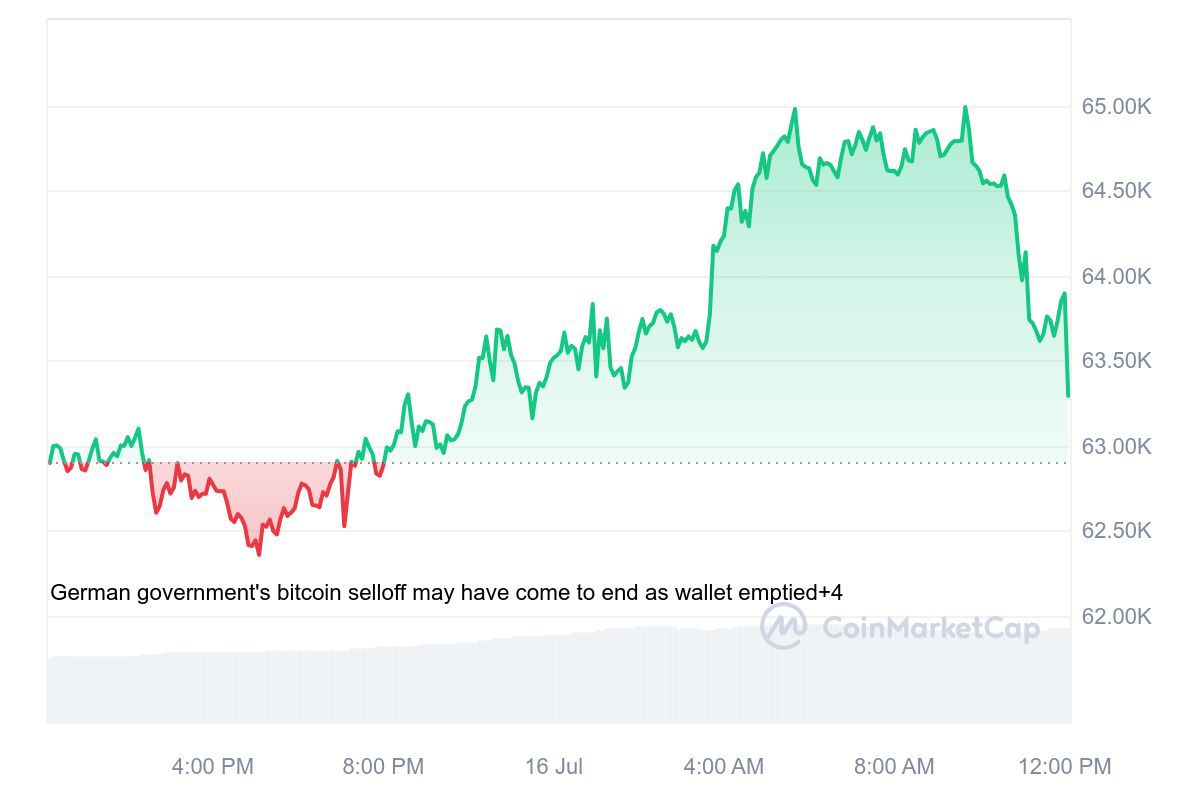
BTC/USD 1D price chart
Bitcoin is currently trading at around $63,300 on July 16, 2024, with BTC/USD trading higher by a margin of 0.5% in the last 24 hours. Bitcoin’s market cap was trading at around $1.2 trillion in the last 24 hours.
BTC/USD is trading higher than its 20-day EMA ( around 60,500), as BTC’s 24-hour volume was at around $36.5 billion. The global crypto market cap increased by around 4.7%, trading above $2.3 trillion. BTC’s year-to-date returns are at above 51%.
Join Millionero to begin trading crypto in a simplified way!