
With Bitcoin trading just above $60,000 in the last two days, the overall crypto price patterns have been static, with no major shift in their trajectories.
The state of the crypto market has been relatively stable during the weekend, with no major price change. As a result, crypto price patterns have been broadly neutral. On the other hand, Bitcoin is facing price pressure at $60,000, although it is still holding on to it as its support. Other crypto tokens are on a similar trajectory, without much volatility.
With this week’s price uptrend, Bitcoin’s graph represents a V-shaped recovery. From below $50,000, it hit $60,000 with a sharp price jump. Although a slowdown has persisted for a few days, the support is still firm. Experts and analysts have pointed towards BTC’s $62,000 price zone as the key resistance zone. If bulls are able to overcome it this week, then the rally could continue longer.
The current sentiments in the crypto market could be indicative of a bear trap. As a result, Bitcoin’s trading range may mimic a parabolic direction in the next few days. The next catalyst for a price breakout could occur once it crosses the 20-day moving average.
Meanwhile, tokens like ETH are still hovering above $2,600, but their weekly average is still in the red. However, tokens like SOL and XRP have posted positive weekly gains, which is a good sign.
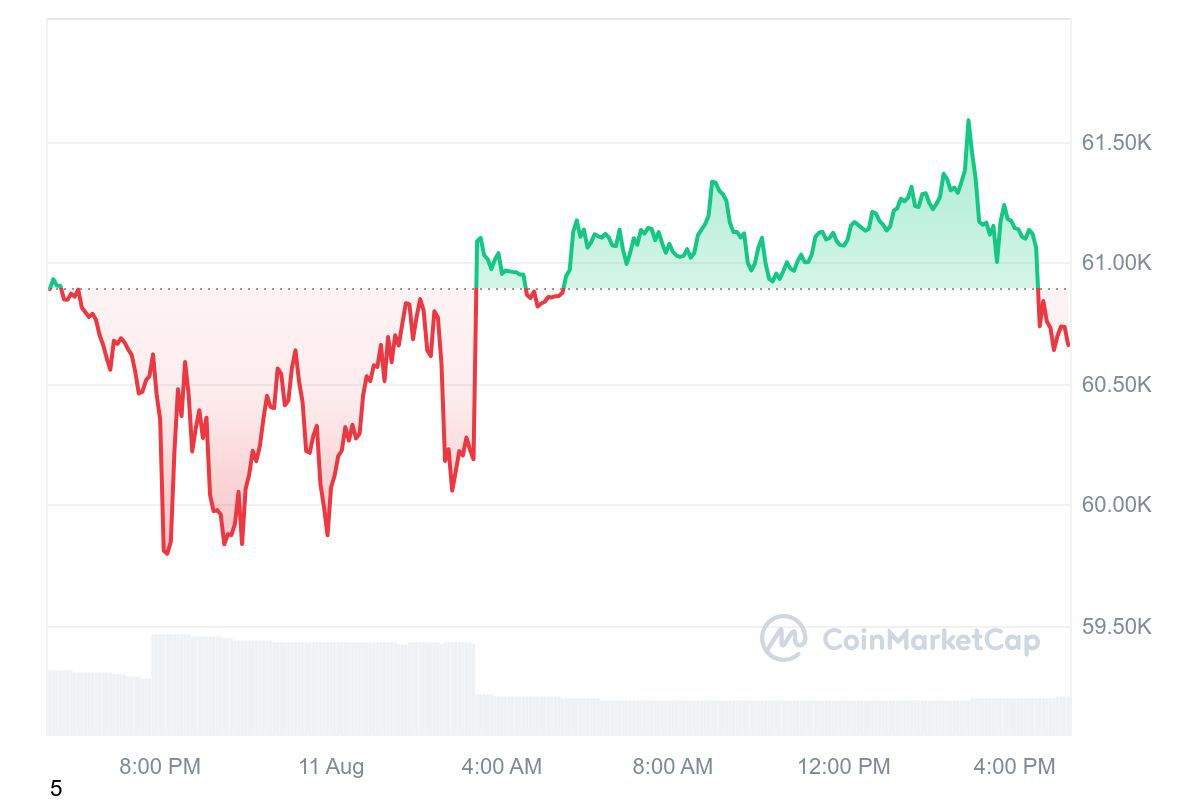
BTC/USD 1D price chart
Bitcoin is currently trading at around $60,300 on August 11, 2024, with BTC/USD trading lower by a margin of around 0.3% in the last 24 hours. Bitcoin’s market cap was trading at around $1.1 trillion in the last 24 hours.
BTC/USD is trading below its 20-day EMA (around 63,300), as BTC’s 24-hour volume was at approximately $16 billion. The global crypto market cap decreased by around 0.5%, trading above $2.1 trillion. BTC’s year-to-date returns are above 44%.
Join Millionero to start trading and investing in crypto!