At times, the market whispers. Other times, it shouts! Through all the noise, how do you hear it? When should you wait, and when should you act? For Bitcoin traders, the RSI on Bitcoin charts isn’t just a line on a chart. It’s a conversation with the market, a dialogue about momentum, sentiment, and opportunity.
The RSI: More Than Just Numbers
The RSI isn’t magic. It’s not a crystal ball. But it’s a tool.
It serves as an instrument that reveals the market’s feelings.
Developed by J. Welles Wilder Jr., the RSI measures the speed and change of price movements. It changes between 0 and 100. But the number itself is not that important.
The importance is in what it could tell you about the other traders.
Why Bitcoin Traders Should Care
Bitcoin doesn’t sleep. A 24/7 global market powered by emotions, speculations and news. Volatility is a feature characteristic of this environment rather than a defect. In this ever-changing landscape, the RSI offers a glimpse, a signal into overbought or oversold conditions. It’s like reading the mood of the room.
Are traders euphoric? Fearful? The RSI helps you see beyond the price.
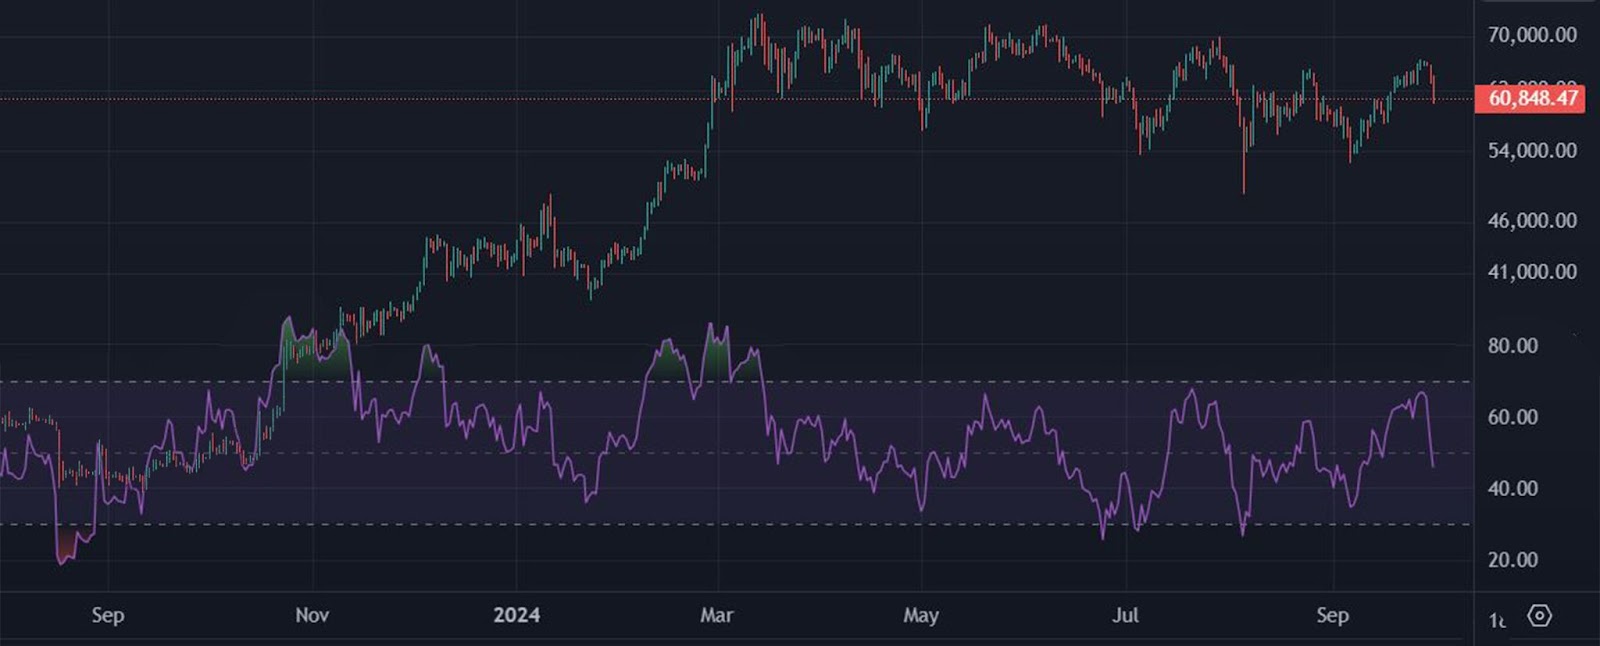
Setting Up RSI on TradingView
TradingView isn’t just a platform.
It acts as a stage for data to come to life.
To add the RSI to your Bitcoin chart:
1. Open your Bitcoin chart on TradingView.
2. Click on “Indicators” at the top.
3. Type “Relative Strength Index” in the search bar.
4. Choose to insert it in your chart.
Simple.
But the real work begins now.
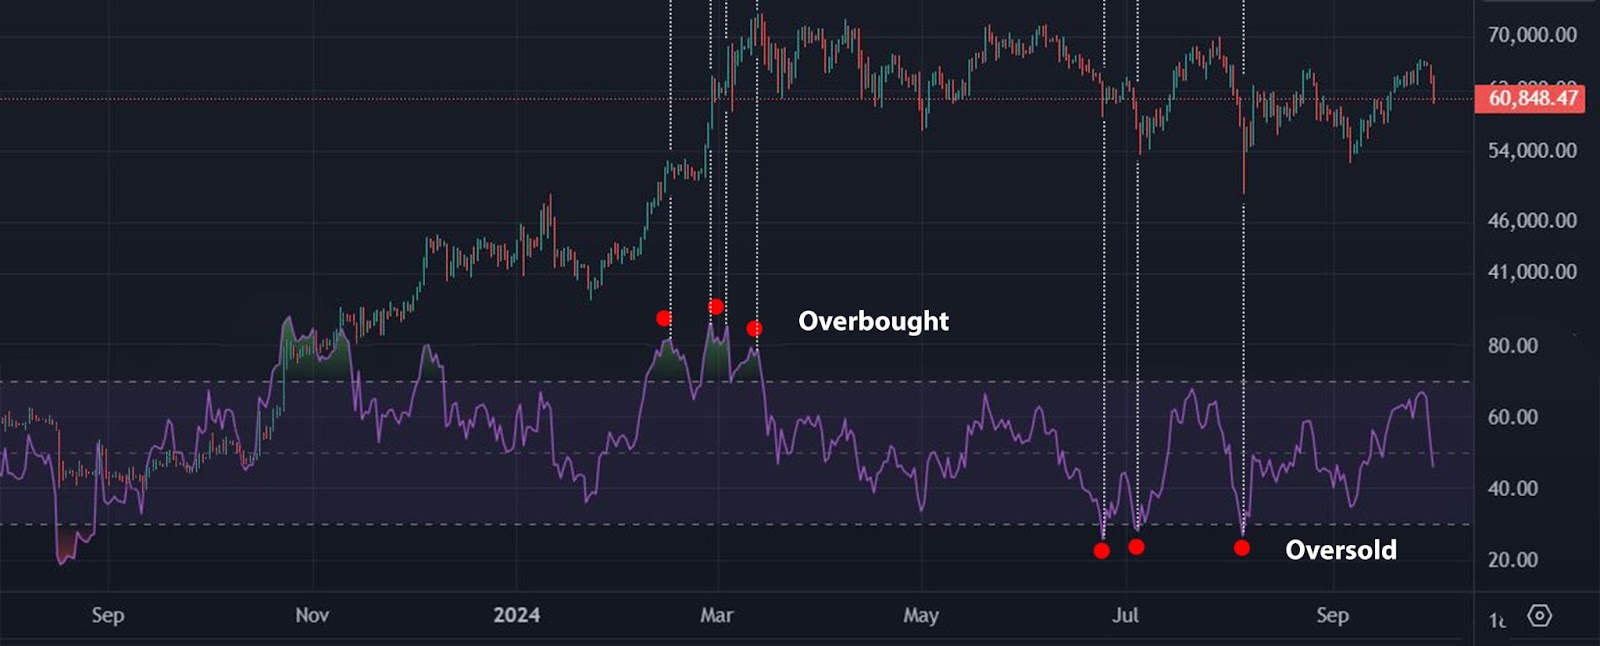
Interpreting the Signals
Numbers are easy.
Interpretation is hard.
When the RSI crosses above 70, the asset might be overbought. Reaching values under 30 might suggest an oversold asset. Do not forget that ‘might’ is a crucial term.
Markets are complex.
Signals aren’t guarantees.
They are prompts for questions.
Why is the RSI high? Is there news shaping the trend? Is this a trend or a fluke?
Use the RSI to ask better questions, not just to get easy answers.
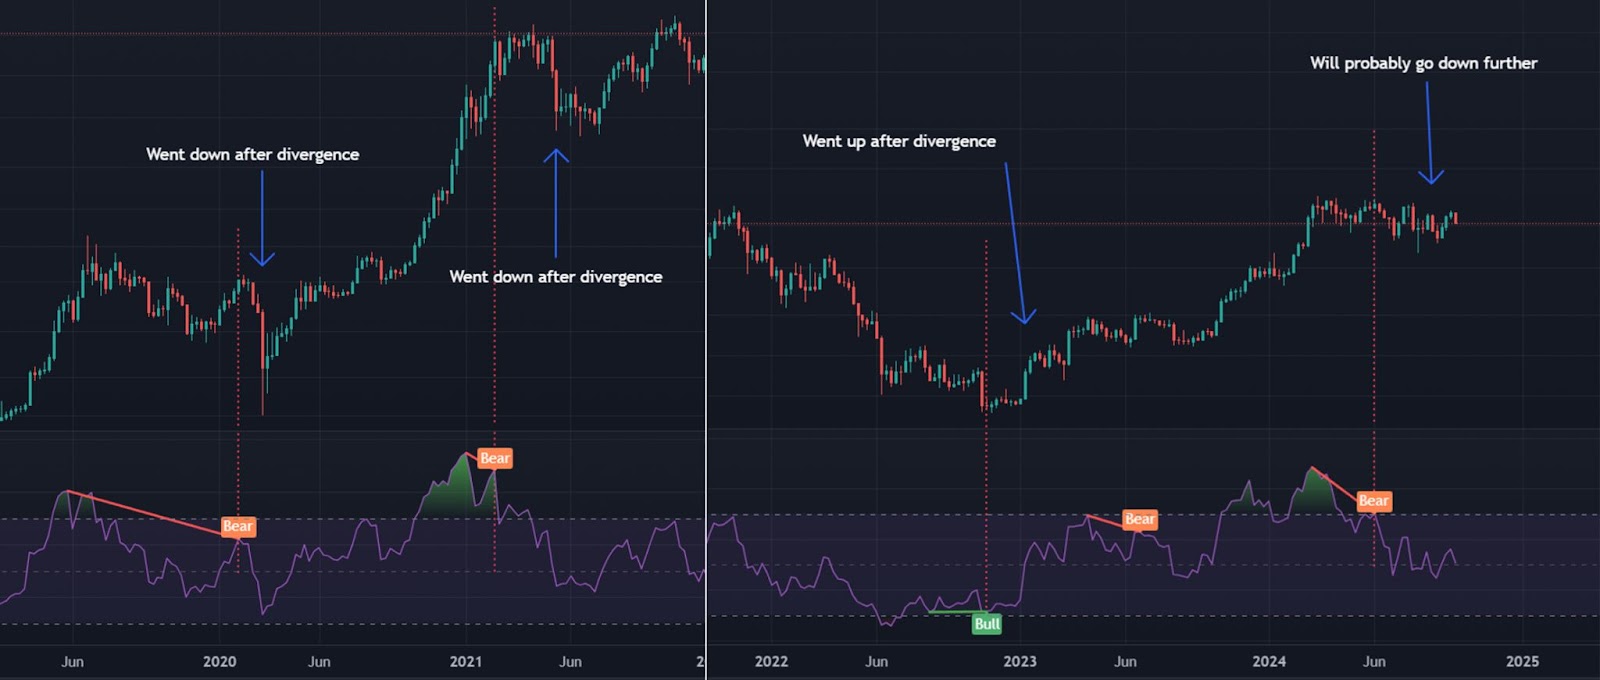
Divergences: When RSI and Price Disagree
Sometimes, the RSI tells a different story than the price chart.
This divergence may indicate a likely reversal.
If the price makes a new high but the RSI doesn’t, pay attention. It is comparable to hearing a tone that’s slightly off in a symphony piece.
It might mean a change is coming.
Avoiding the Traps
Tools can be misused.
Relying solely on the RSI is like driving with one eye closed.
Combine it with other indicators.
Pay attention to the volume. observe how the trends change. Find the patterns.
And remember, overbought doesn’t mean the price will drop immediately. Oversold doesn’t mean it will bounce right away.
Practicing patience is not merely a good quality; it is a valuable technique.

The Human Element
At the end of the day, charts and indicators are reflections of human behavior.
Fear and greed.
Hope and despair.
The RSI quantifies these emotions.
Ultimately it is your decision and responsibility.
Use the RSI as a guide, not a dictator.
Trust your analysis.
Learn from mistakes.
Stay curious.
Conclusion
The market doesn’t owe you anything.
It merely offers opportunities to learn.
The RSI is a tool—a way to understand the heartbeat of Bitcoin trading.
Listen carefully. Interpret thoughtfully. Act wisely.
Because in trading, as in life, it’s not just about the signals you receive.
It’s about how you choose to respond.
Want more insights on mastering crypto trading? Visit the Millionero blog for expert tips and strategies!