
If you’ve ever stared at a Bitcoin (BTC) price chart and wondered what all those colorful lines mean, you’re not alone. Traders often use moving averages (MAs)—special lines based on past price data—to help them make decisions. While there are many types of MAs, just a few can make a big difference if you understand them.
Let’s break down three of the most important ones that Bitcoin traders, both big and small, pay close attention to.
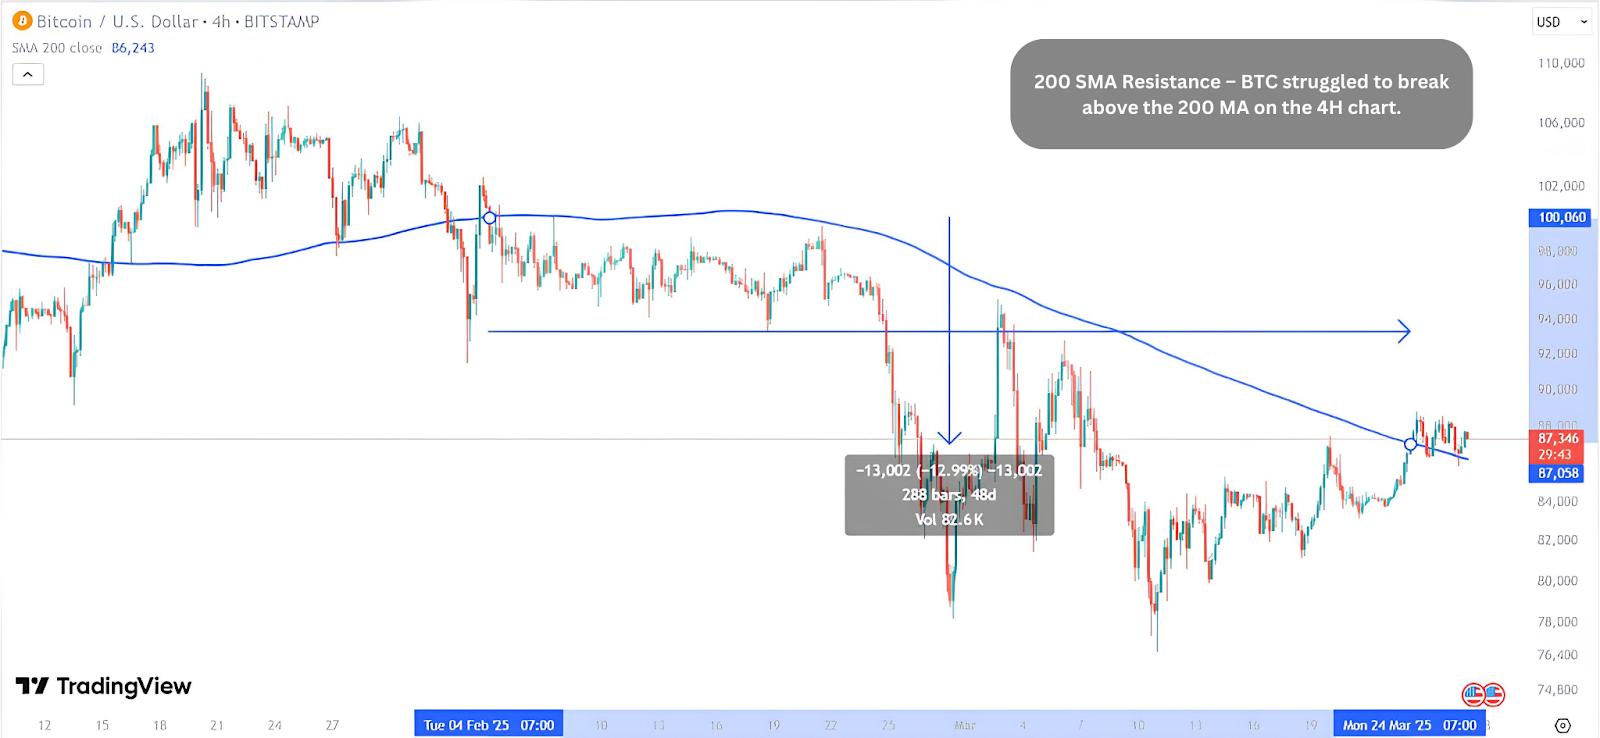
1. The 200 MA – Bitcoin’s Line of Respect
One of the most powerful and widely respected lines is the 200 MA, which stands for the 200-day (or candle) moving average. It can be a Simple Moving Average (SMA) or Exponential Moving Average (EMA)—either way, it’s a big deal.
Why does it matter?
Because time and time again, Bitcoin tends to “respect” this line. That means it often bounces off the 200 MA like a trampoline during uptrends, or gets rejected by it during downtrends. It’s like a long-term fence for price.
- On any timeframe (4H, 1D, or 1W), the 200 MA acts as a key support or resistance level.
- If BTC is above the 200 MA, traders often consider the market to be bullish.
- If BTC is below it, many will say it’s bearish or at least cautionary.
Source | Tradingview
It’s not magic—it’s just a long-term average. But in a market as emotional as crypto, long-term trends carry weight.
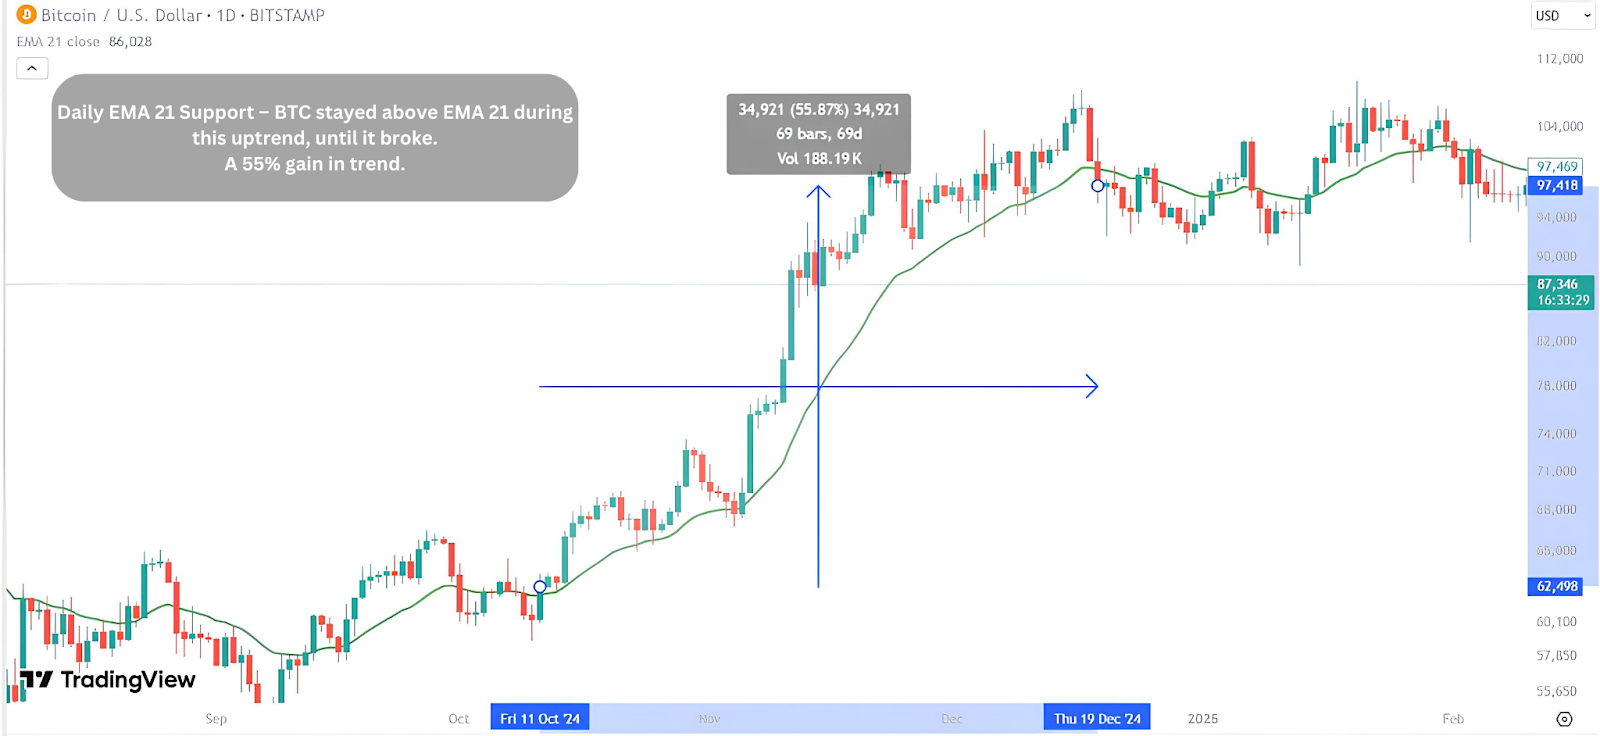
2. EMA 21 (Daily) – A Favorite Among Pros
Some moving averages respond faster to price changes. That’s where the Exponential Moving Average (EMA) comes in. Unlike the SMA, which gives equal weight to all days, the EMA focuses more on recent price movements, making it more responsive.
The EMA 21 on the daily chart is a favorite among professional traders.
Why?
Because this line often acts like a “dynamic support” during uptrends—BTC frequently dips down to the EMA 21 before bouncing back up. When the price stays above this line, it’s usually a healthy uptrend. If it breaks below, traders get cautious.
Source | Tradingview
Think of EMA 21 as a trend health meter.
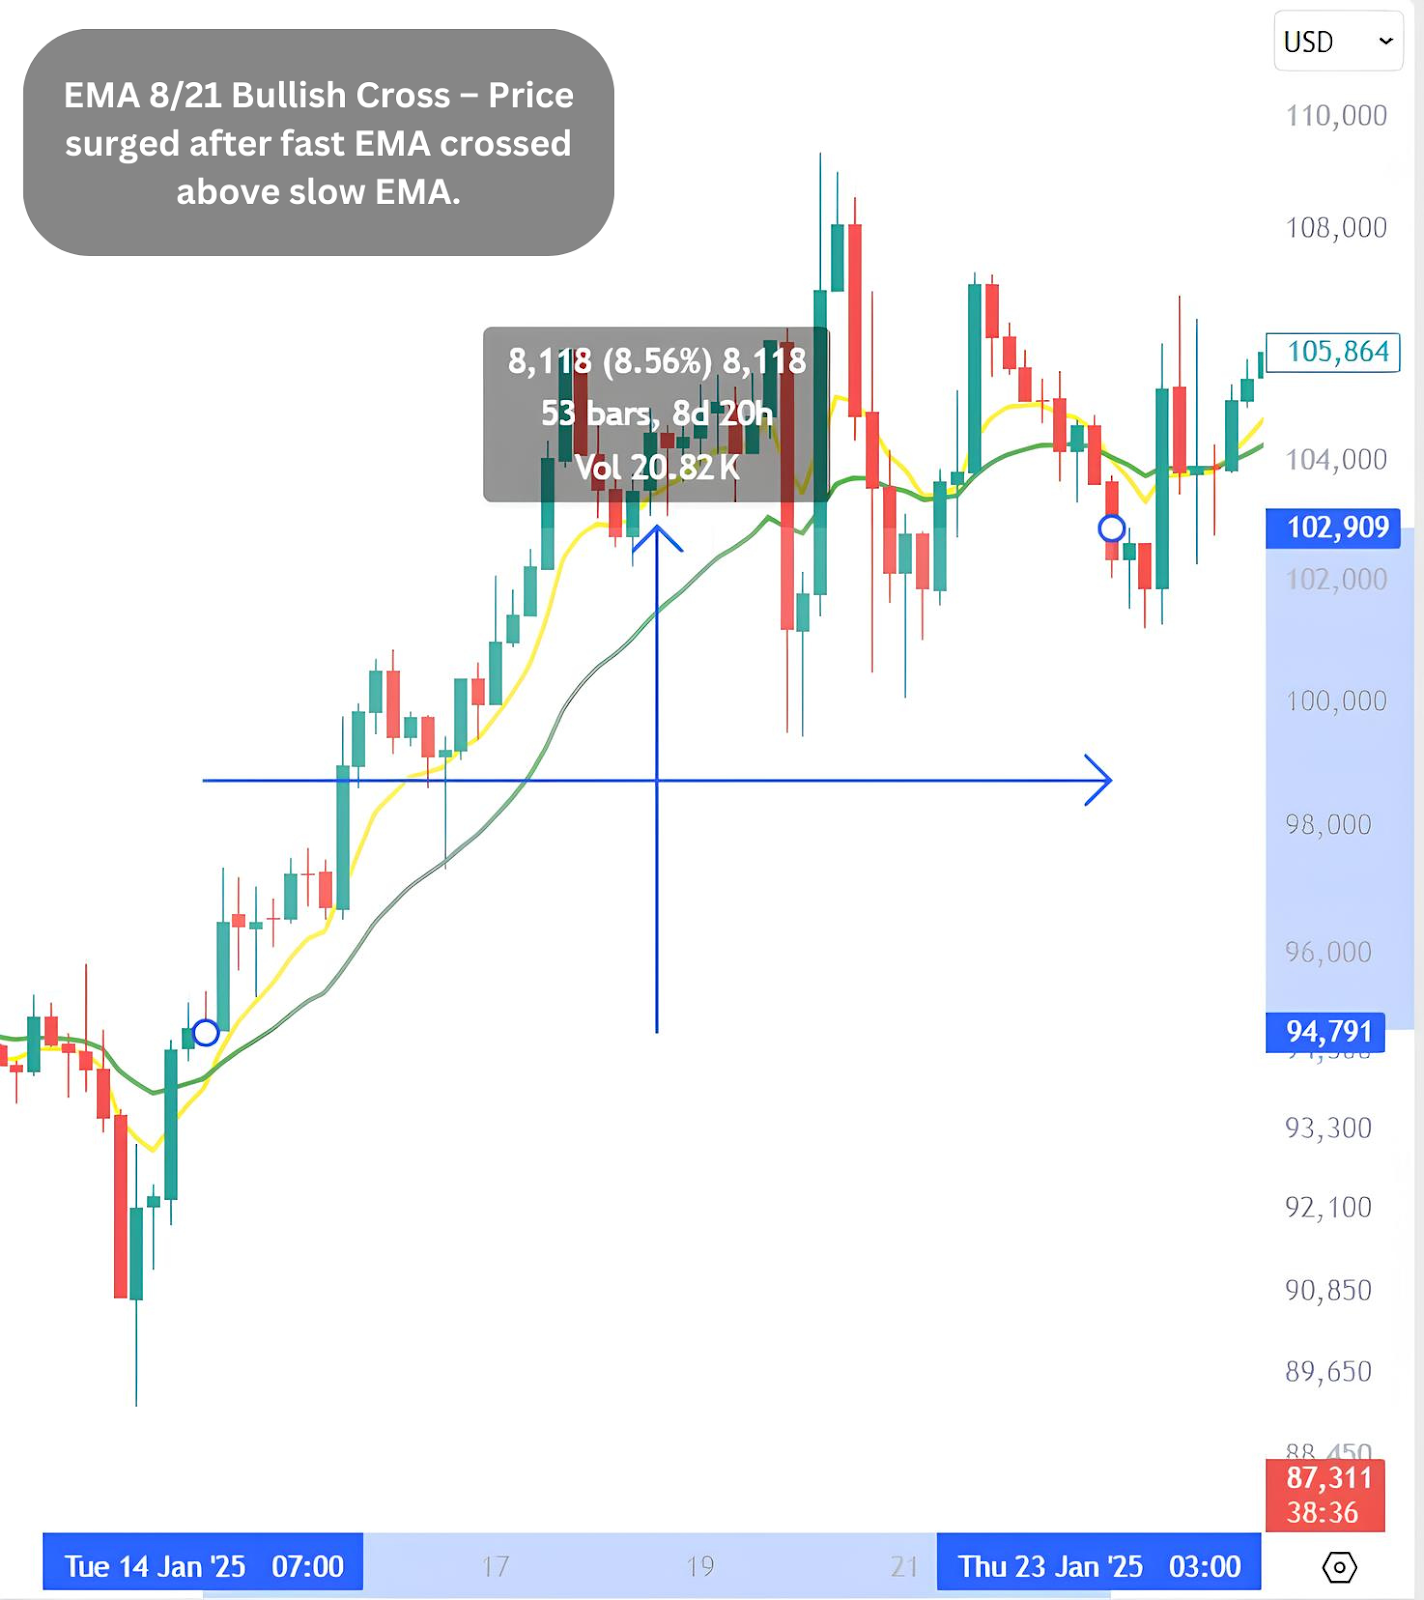
3. EMA 8/21 Cross (4H) – A Powerful Entry Signal
Here’s a trick many swing traders love: the EMA 8/21 cross on the 4-hour chart.
Source | Tradingview
- When the EMA 8 crosses above the EMA 21, it’s often a bullish signal—the trend is gaining upward strength.
Source | Tradingview
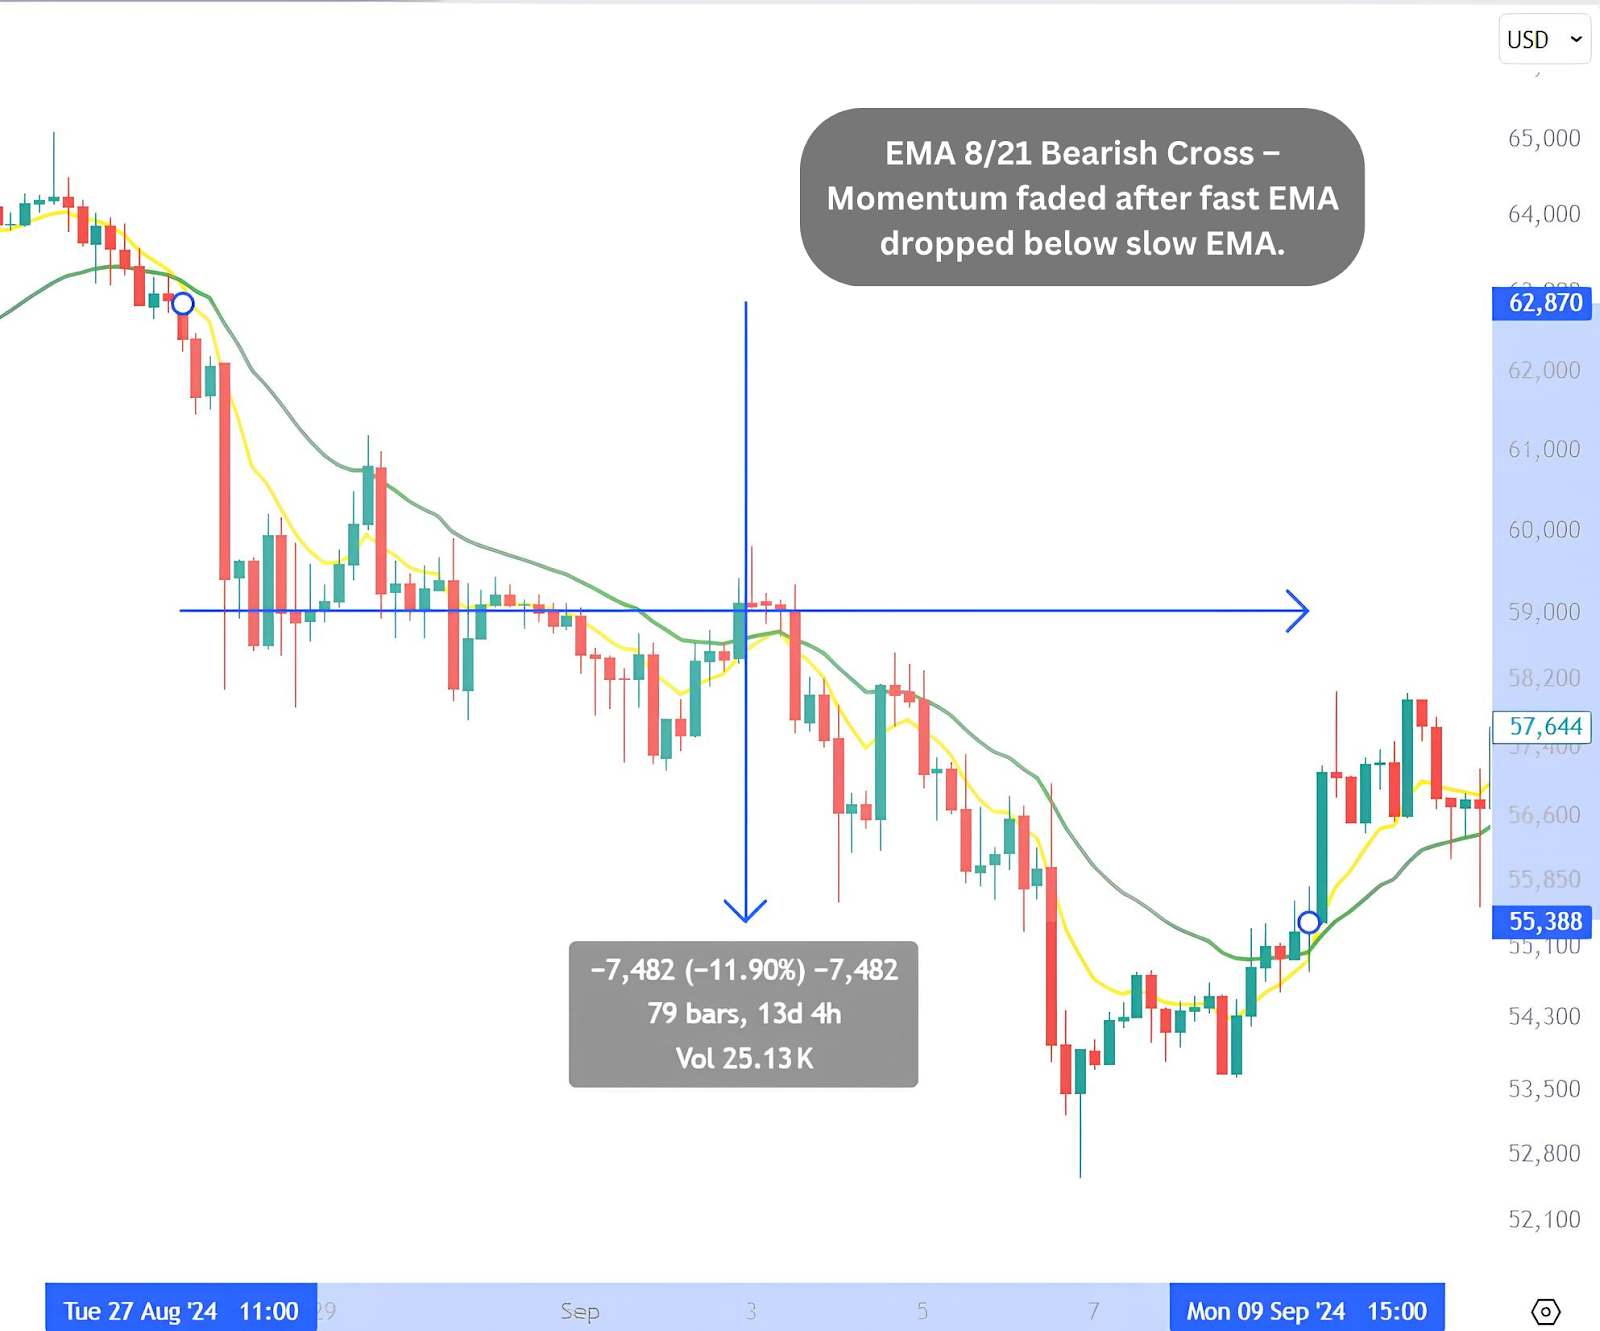
- When the EMA 8 crosses below the EMA 21, it’s a bearish signal—momentum might be fading.
This cross helps traders spot momentum shifts early, giving them a possible edge in entering or exiting trades. It doesn’t predict the future, but it does give timely clues.
Final Thoughts
If all this sounds like just lines on a chart, that’s okay. But to many traders, these lines are guides in the chaos. They don’t guarantee profits, but they help make sense of where Bitcoin might be headed.
So next time you’re checking BTC’s chart, take a look at:
- The 200 MA for the big picture,
- The EMA 21 (daily) for trend health, and
- The EMA 8/21 cross (4H) for possible trade entries.
A few lines, a bit of understanding, and suddenly the chart starts speaking your language.
This article is not financial advice. Please do your own research (DYOR) before making any investment decisions. You can start DYOR at blog.millionero.com. When you feel ready, come trade spot and perpetual futures securely on Millionero.