When you trade Bitcoin, you’ll often hear about a tool called the Relative Strength Index (RSI). It looks like a line moving between 0 and 100 and helps traders guess if Bitcoin is too expensive (overbought) or too cheap (oversold) at a given time.
What is RSI?
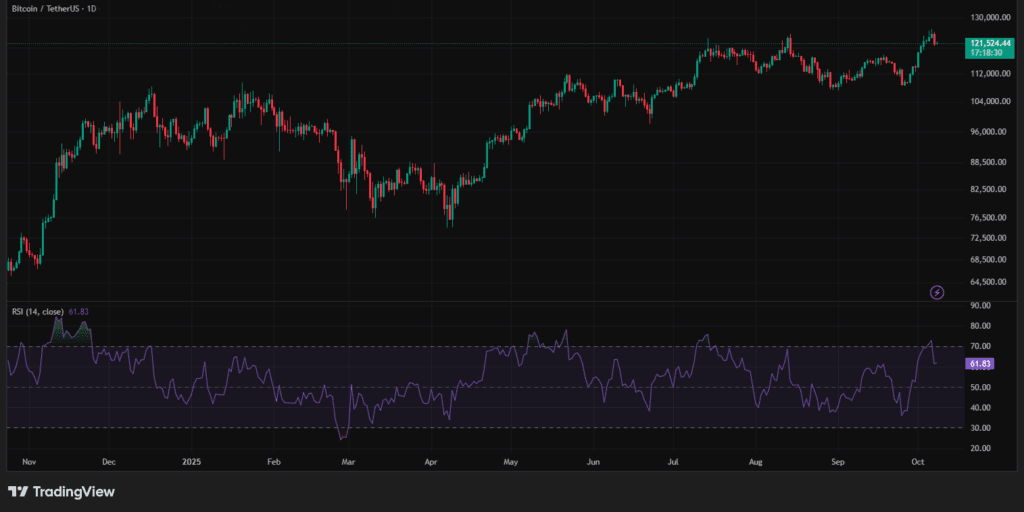
The RSI is a momentum indicator. That means it doesn’t just look at the price, but also at how fast and strong the price is moving.
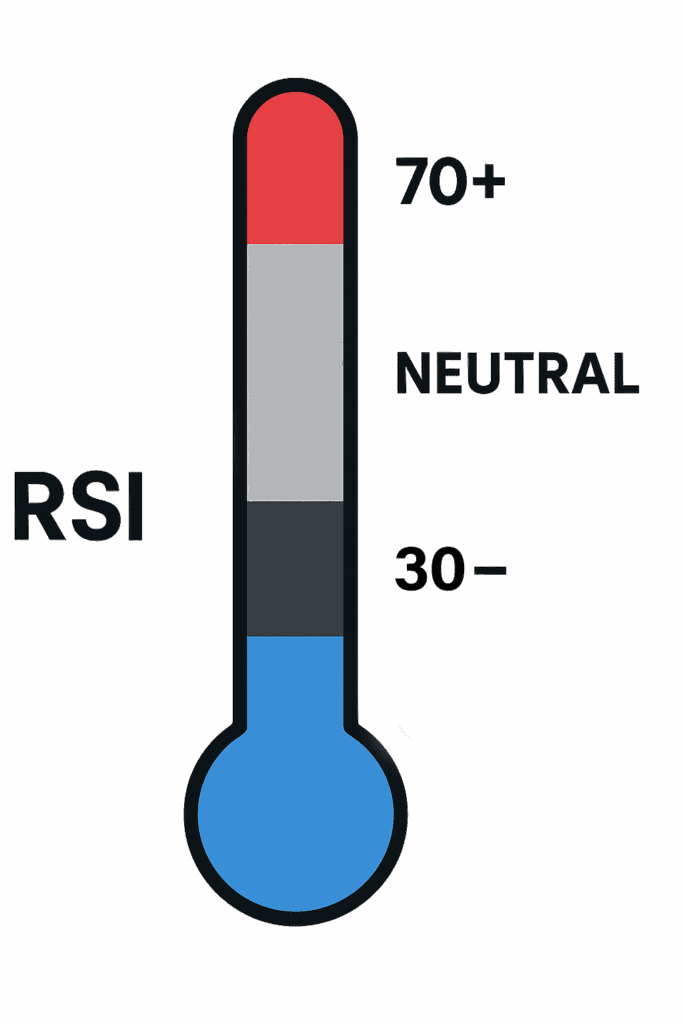
- RSI moves between 0 and 100.
- Above 70 usually means Bitcoin is overbought.
- Below 30 usually means Bitcoin is oversold.
Overbought and Oversold in Bitcoin
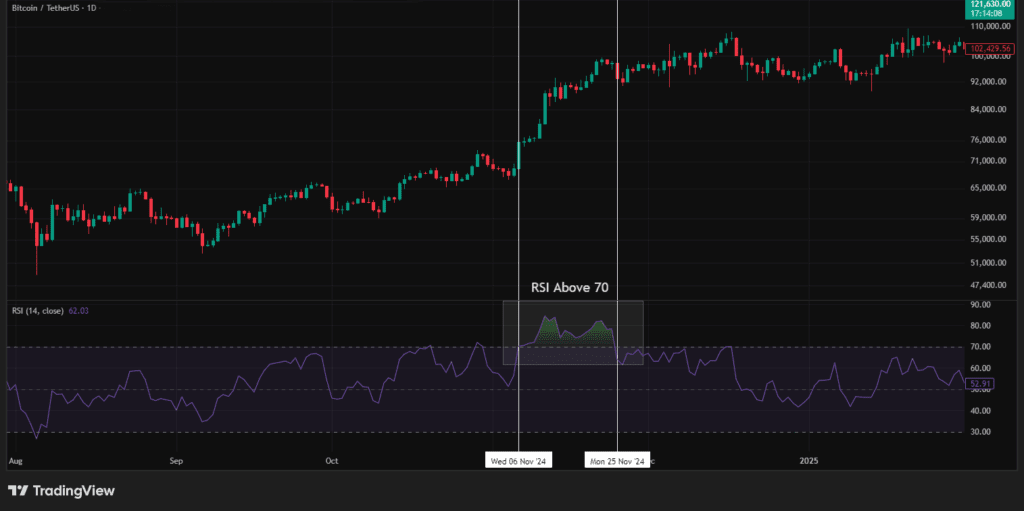
Imagine Bitcoin’s price runs up very quickly from $69,000 to $96,000. The RSI might shoot above 70. This doesn’t always mean the price will crash, but it suggests that many people already bought in, so the fuel for pushing the price even higher may be running out.
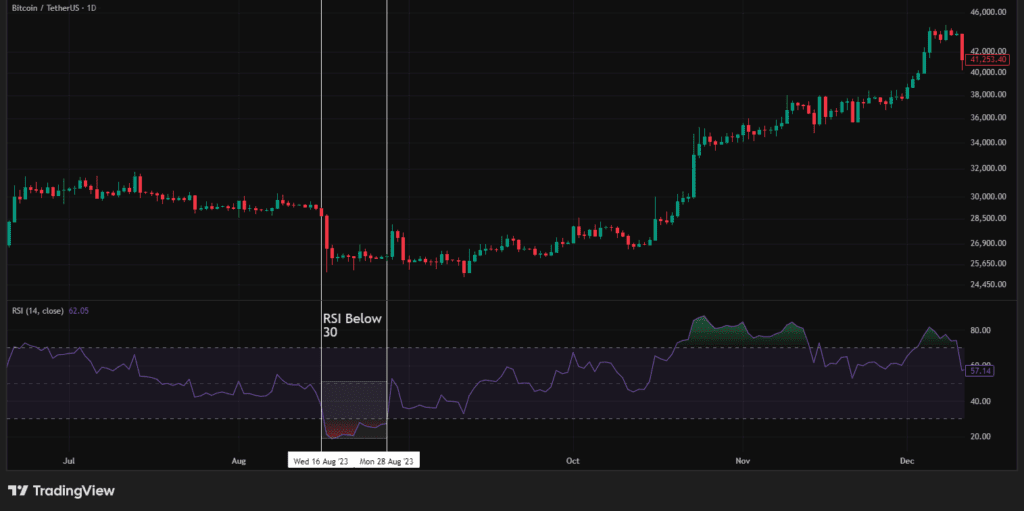
On the other side, if Bitcoin falls sharply from $29,000 to $26,000, the RSI might dip under 30. This suggests Bitcoin could be “too cheap” because many traders have sold off quickly, and buyers may soon step back in.
How to Actually Read RSI in Bitcoin Charts
Look at the Levels (70 and 30):
These are the first red flags. Above 70 = possible overbought. Below 30 = possible oversold.
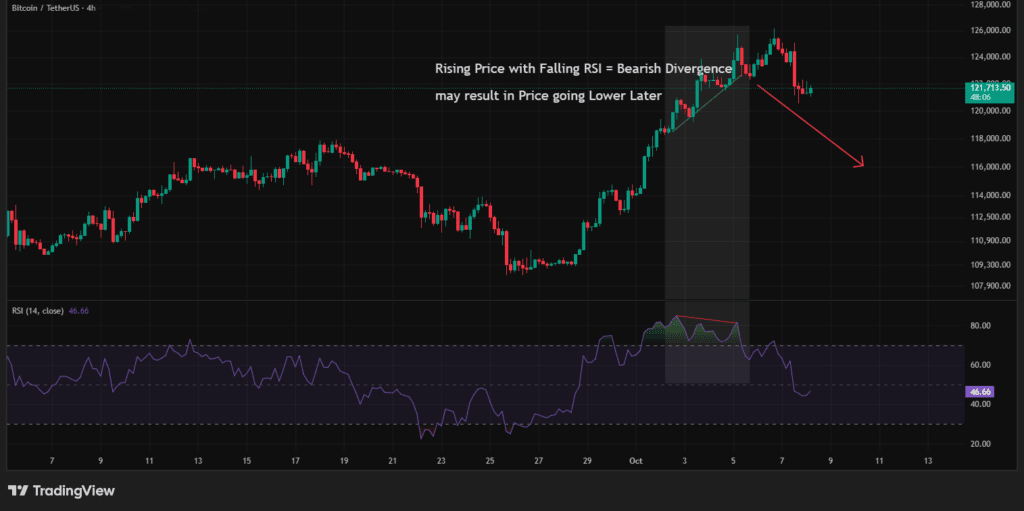
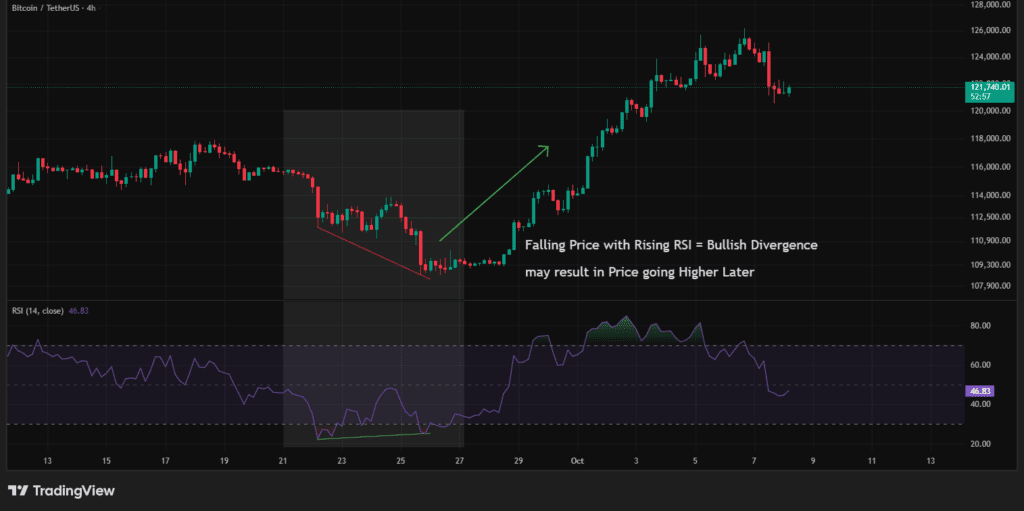
Watch for Divergence:
Sometimes Bitcoin’s price and RSI tell two different stories. For example:
- BTC makes a new high, but RSI makes a lower high → this could be a sign of weakening momentum. This is called Bearish Divergence.
- BTC makes a new low, but RSI makes a higher low → this could mean selling pressure is fading. This is called Bullish Divergence.
Look at Midline (50):
RSI crossing above 50 often means the trend is turning bullish. Dropping below 50 can mean it’s turning bearish.
Common Mistakes with RSI
- Taking it as an automatic signal: Just because it hits 70 doesn’t mean Bitcoin must drop. In strong bull markets, BTC can stay above 70 for weeks.
- Ignoring bigger trends: RSI works best when combined with the bigger picture. For example, in a strong bear market, an “oversold” signal may not mean a big bounce, just a small pause before falling again.
- Using only one timeframe: RSI on a 1-hour chart may say oversold, but on the daily chart it may still be overbought. Always check more than one timeframe.

How Traders Use RSI in Bitcoin
- Quick Trades: A trader may buy Bitcoin when it dips below 30 and sell when it jumps above 70.
- Trend Confirmation: Long-term traders might only take signals that agree with the bigger trend. For example, buying when it is oversold during a bull market.
- Spotting Weakness: Watching divergence to prepare for possible reversals.
Final Thoughts
RSI is not magic. It’s just a tool to help you understand how strong or weak Bitcoin’s price moves are. It works best when combined with other indicators and when you pay attention to the bigger trend.
For beginners, think of it like a “temperature check”:
- Above 70 → Bitcoin may be “too hot.”
- Below 30 → Bitcoin may be “too cold.”
- Around 50 → Bitcoin is “normal.”
This article is for educational purposes only. It is not financial advice. Always do your own research before trading. You can trade Bitcoin and other cryptocurrencies on Millionero Spot or Millionero Perpetuals.