When traders look at Bitcoin charts, the first thing they often notice is the price. But if you stop there, you’re missing half the story. Price tells you what happened, volume tells you how strong it really was. Understanding how to read volume is like learning to hear the heartbeat of the market. Let’s break it down in a simple way, step by step.
What is Volume?
In trading, volume is the number of Bitcoin units traded during a certain time.
- On a 1-hour chart, the volume bar shows how much BTC changed hands in that one hour.
- On a daily chart, the bar shows how much was traded that day.
Think of it like this: if price is the headline, volume is the crowd reaction. Was it a whisper? Or a roar?
Why Does Volume Matter?
Volume confirms price moves. Price can go up or down for a short moment, but without strong volume, it’s like a weak push, it often doesn’t last.
- High volume = strong conviction. Buyers or sellers are serious.
- Low volume = weak move. Price may reverse or fade quickly.
For example, if Bitcoin jumps from $111,000 to $120,000 but volume is tiny, it’s suspicious. But if the same jump comes with huge trading volume, it’s powerful.
Reading Volume with Price
Here are the main ways traders use volume to understand Bitcoin’s story:
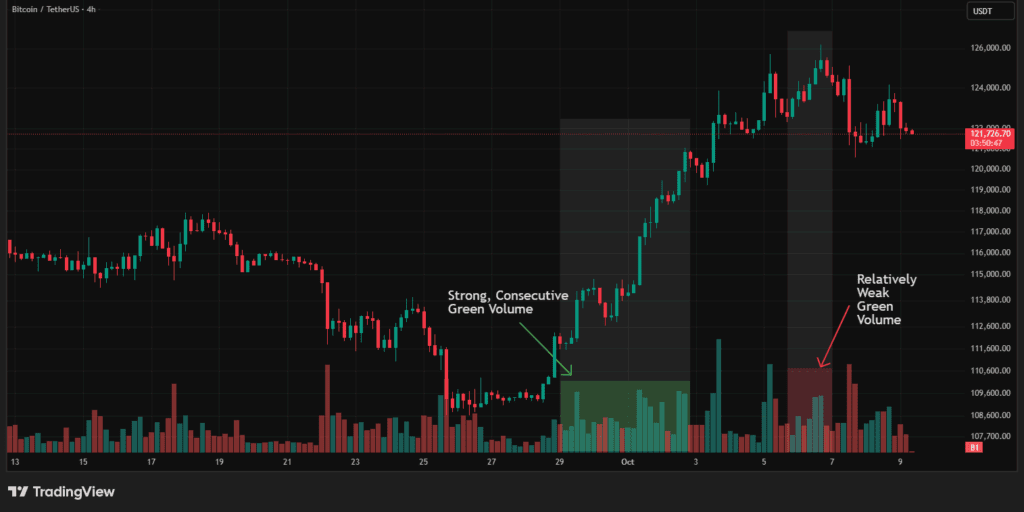
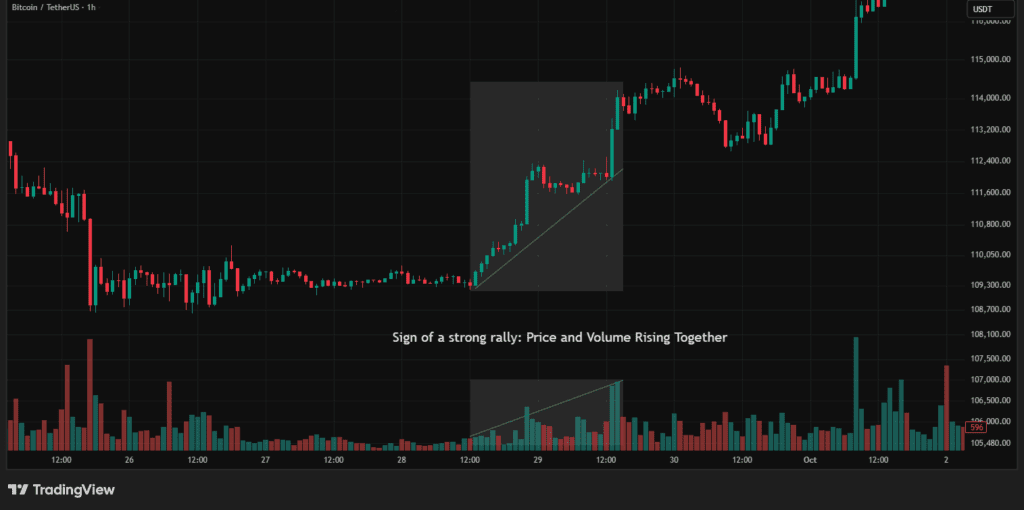
1. Volume Rising with Price (Bullish Confirmation)
When BTC goes up and volume also rises, it means buyers are fully behind the move. This usually supports a trend.
- Example: Bitcoin climbing steadily from $109,000 to $114,000 with growing volume means the rally is healthy.
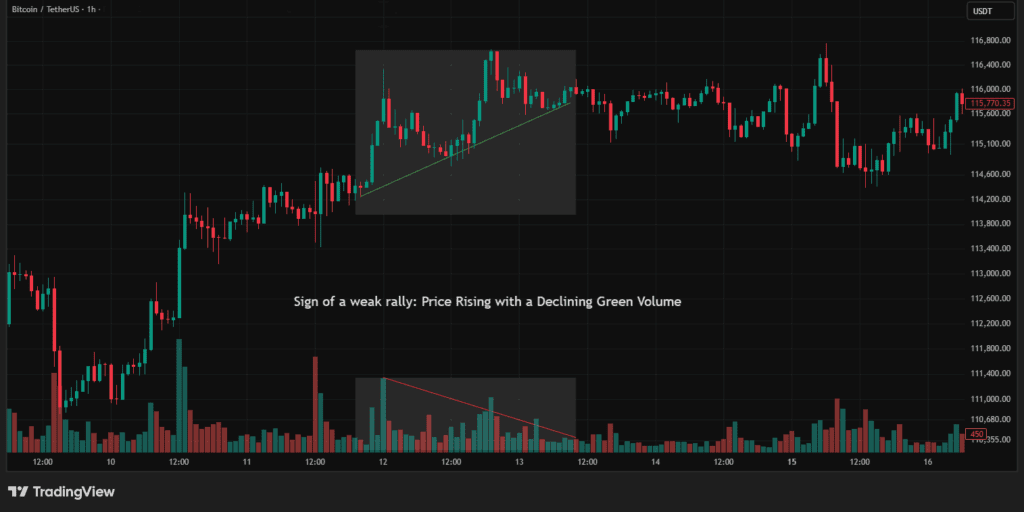
2. Volume Falling with Price Rise (Weak Rally)
If BTC rises but volume falls, it’s a warning sign. Fewer buyers are joining in. The move may collapse soon.
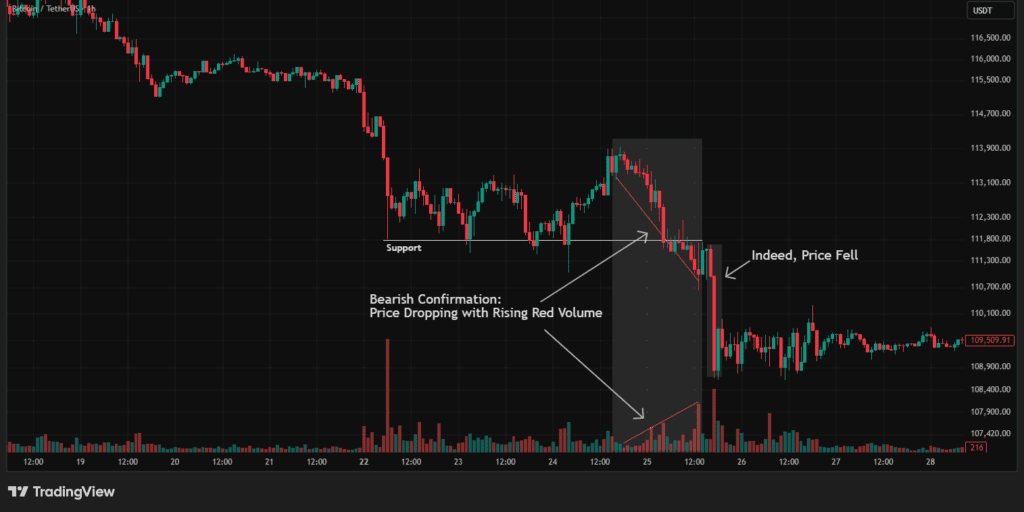
3. Volume Rising with Price Drop (Bearish Confirmation)
When Bitcoin falls hard and volume spikes, sellers are in control. This is often the start of a stronger downtrend.
4. Volume Falling with Price Drop (Weak Sell-off)
If BTC dips but volume is low, it may just be noise. The trend could bounce back quickly.
Spotting Breakouts
Volume can also help you spot when a trend is about to flip.
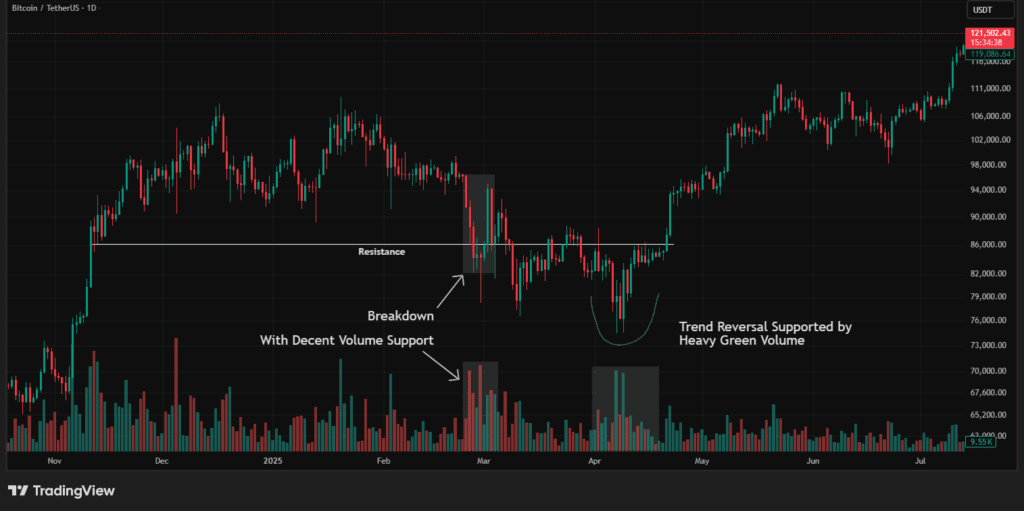
- Climactic Volume: When volume suddenly spikes to extreme levels, it often marks the end of a move. For example, if Bitcoin crashes from $102,000 to $76,000 with record-high selling volume, it could signal panic selling, and sometimes the bottom.
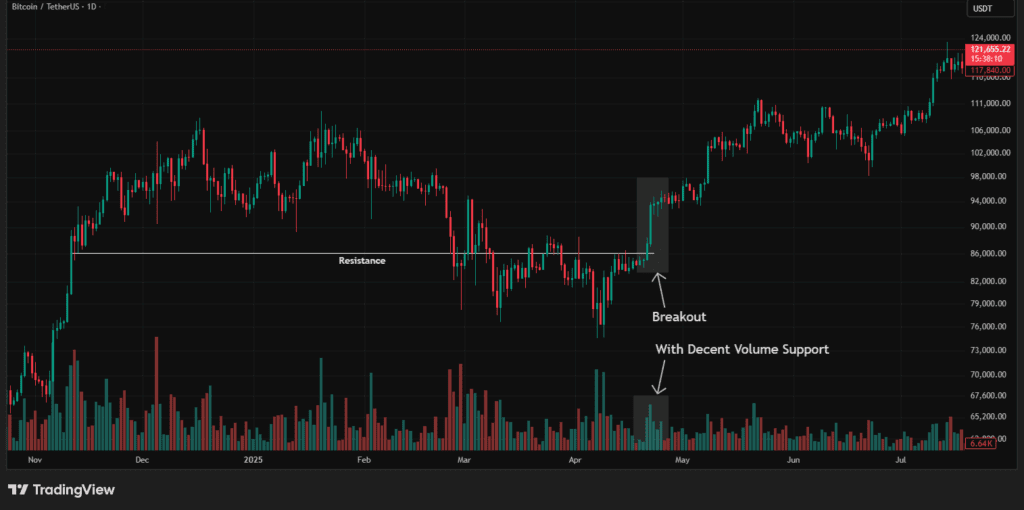
- Breakouts: If BTC breaks out of a range (say, moving above $86,000 after weeks of sideways trading) with big volume, the breakout is likely real. Without volume, it could be a fake-out.
Volume and Support/Resistance with Reversal
Support and resistance levels become stronger if they are confirmed with volume.
- If Bitcoin bounces off $76,000 with high volume, that level is a strong support. It might be trend reversal.
- If it breaks below $86,000 with heavy volume, support is broken and the trend may continue lower.
This is why traders always check the volume at key levels.
Mistakes to Avoid
- Only looking at price: Always check the volume below the chart.
- Forgetting context: A 10,000 BTC volume bar means very different things on a 5-minute chart vs a daily chart.
- Chasing low-volume breakouts: They often fail.
Final Thoughts
Volume is the backbone of technical analysis. It gives life to the candles and shows whether a price move has real strength or not.
For Bitcoin traders, learning to read volume is not about predicting the future perfectly. It’s about improving your odds, spotting strong moves, avoiding weak ones, and understanding when trends might be changing.
So next time you look at a BTC chart, don’t just watch the candles. Look down at the volume bars. They’re telling you the truth behind the price. This article is for educational purposes only. It is not financial advice. Do your own research before trading. You can trade BTC spot and futures anytime on Millionero.