Cryptocurrency trading can be quite lucrative when done right, as showcased by the 2021 bull run right after the Covid crisis, when other financial markets were still recovering from the economic shock. Now, when it comes to making cryptocurrency trading strategies, crypto chart patterns can be a great help.
If you are reading this article, it is fair to assume that you are either interested in cryptocurrency trading or are already doing so. As a beginner, it’s important for you to know how to analyze the crypto market before making investment decisions. Keep reading as we throw light on how to use crypto charts to aid your analysis!
Trading crypto: what are crypto chart patterns?
The importance of technical analysis before trading in any market can never be stressed enough – a good trader always puts in the work! One significant step in the analysis process is spotting and interpreting crypto chart patterns correctly.
Chart patterns are common formations on crypto charts for ups and downs in prices. They allow one to assess past and current trends, and give insight into possible future trend continuation or reversal when it comes to trading crypto.
7 types of crypto chart patterns for crypto trading strategies
Crypto chart patterns are subjective and depend on your individual interpretation in trading crypto, which can make them seem difficult at first. No worries though, we have got you sorted! Let’s dive into the seven most sought-after crypto chart patterns, starting with the head and shoulders pattern for trading crypto.
Head and shoulders/inverse head and shoulders
The head and shoulders pattern is a bearish reversal signal, characterized by a head between two shoulders. It starts with a price rise (shoulder), a retreat to a certain level, and a higher second peak (head), followed by a third peak (shoulder) lower than the second one. Prices then drop to the starting point (neckline). When prices break below the neckline, it signals a shift to a bearish trend, as pictured below.
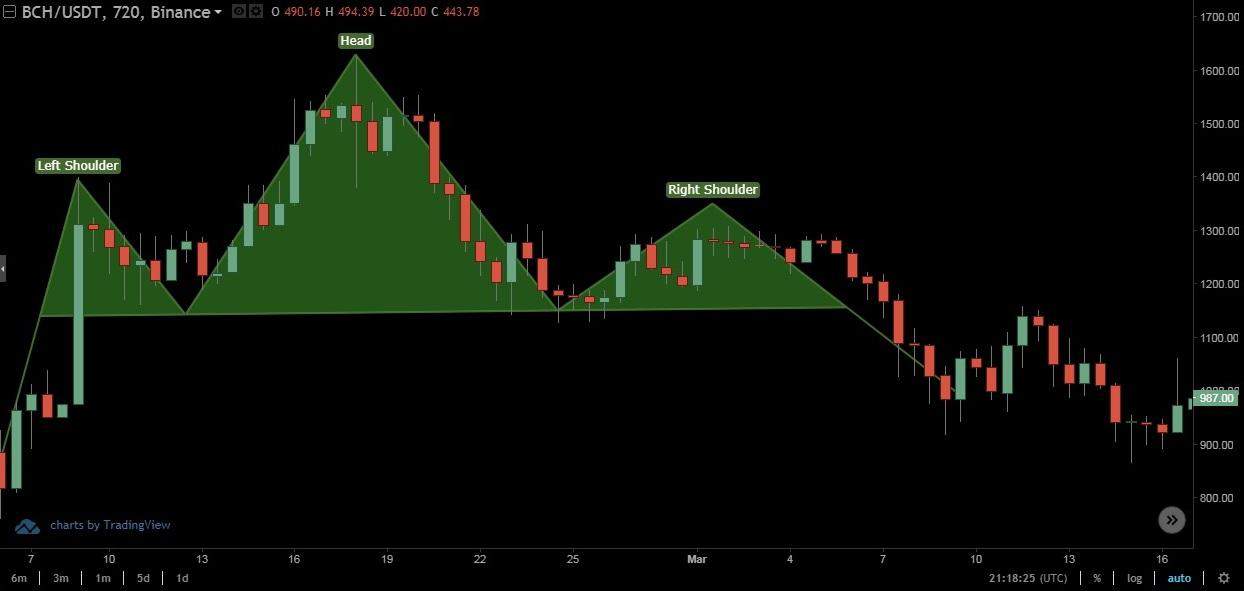
Head and shoulders crypto chart patterns | Source: link
On the other hand, an inverse head and shoulders chart pattern looks like an inverted image of a head and shoulders pattern for trading crypto. It occurs when the price falls to a new low, rises, falls again even lower, rises again and then falls for the third time but not as much as the previous dip. It rises again and eventually breaks above the neckline, indicating a shift from a bearish to a bullish trend.

Inverse head and shoulders chart pattern | Source: link
Double top and double bottom
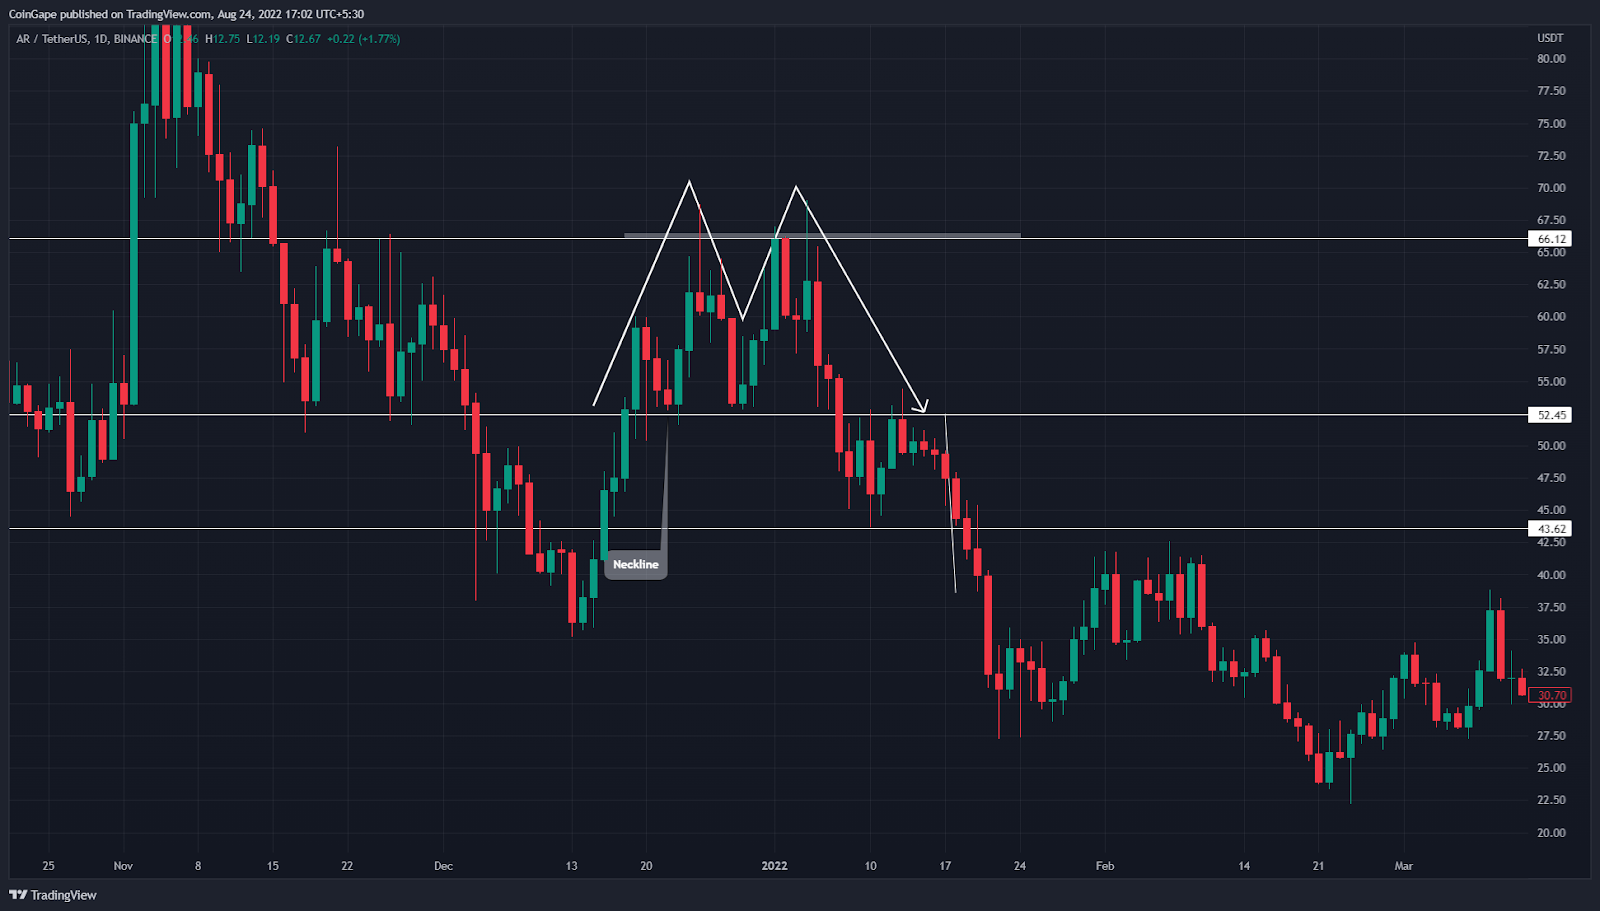
The double top chart pattern looks like an “M” in trading crypto, indicating that the price rises to a peak level and drops back to the level of support. It then climbs again before dipping to the support level and eventually breaking away against the prevailing trend. It is a bearish trend that signifies a shift from an uptrend to a downtrend.
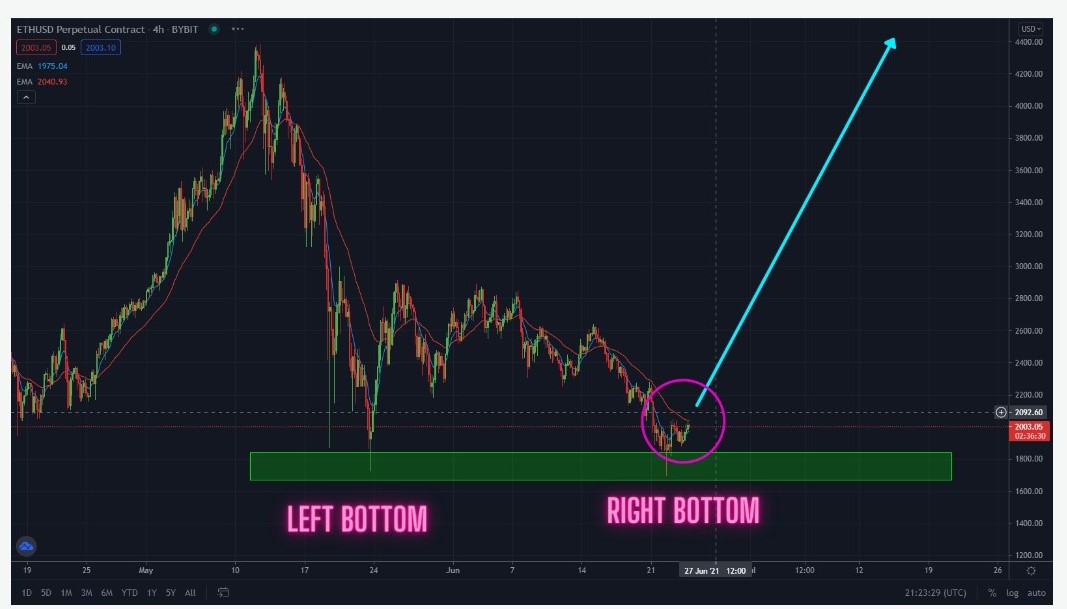
The double bottom chart pattern looks like a “W,” meaning there are two drops. The price falls to a new low, rallies slightly higher near the resistance level, falls back and rises again. Eventually, it rises above the resistance level and signifies a shift from a bearish to a bullish trend.
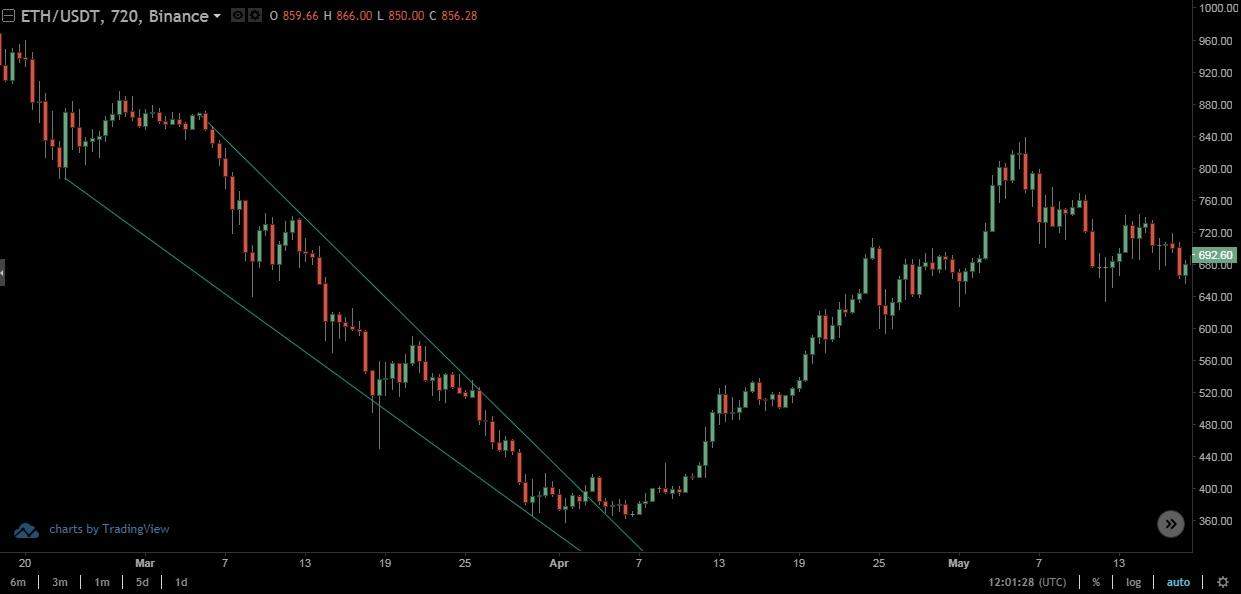
Channel up and channel down
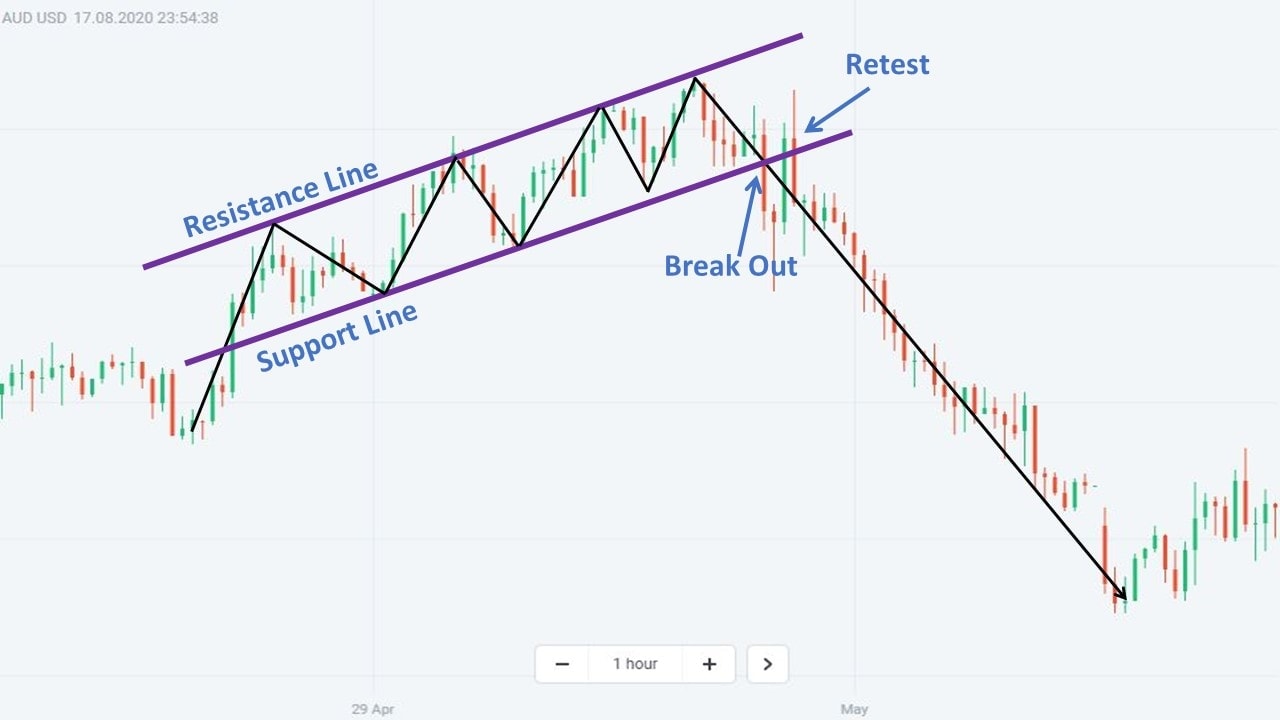
In channel up and down chart patterns, two parallel trend lines act as boundaries (support and resistance levels). The resistance line connects the highs, while the support line connects the lows.
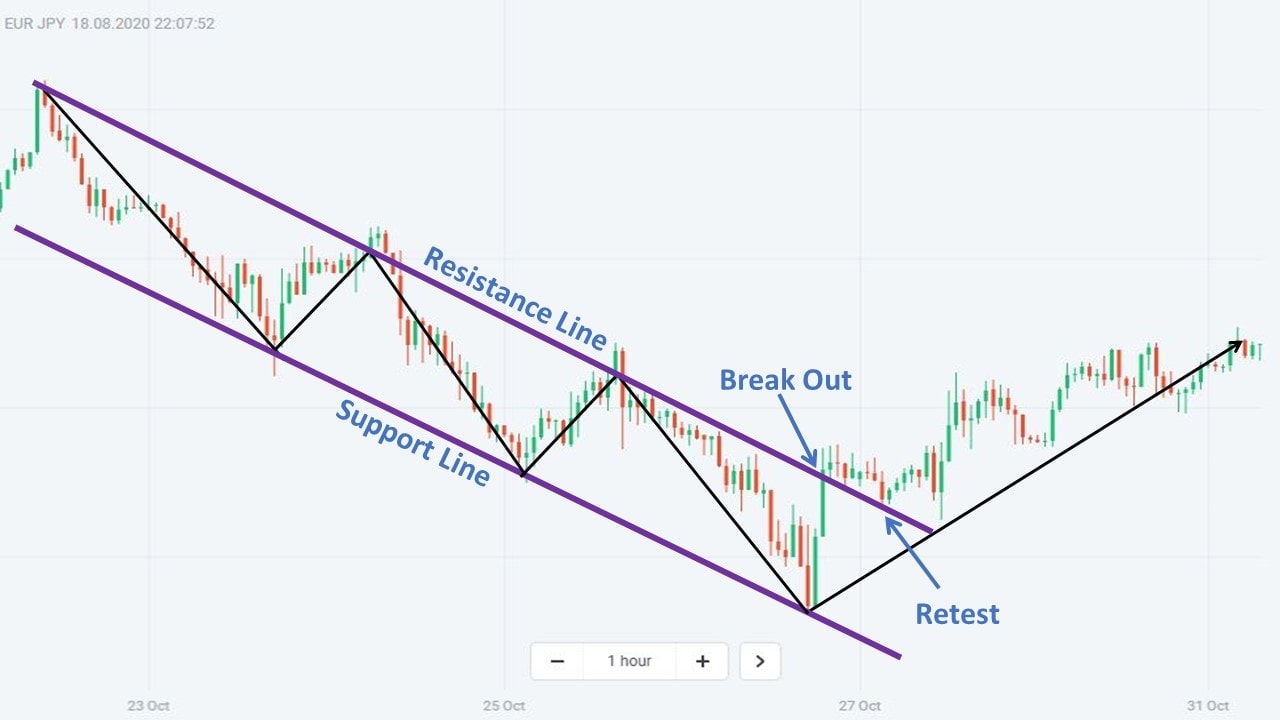
The channel patterns are continuation patterns in trading crypto. Bearish channel continuation patterns have a negative slope. If the prices break from the lower channel line, it indicates continuing the prior bearish trend. Bullish channel continuation patterns have a positive slope. If the price moves above the upper channel line, it indicates a continuation of the prior bullish trend.
Bullish and bearish flags
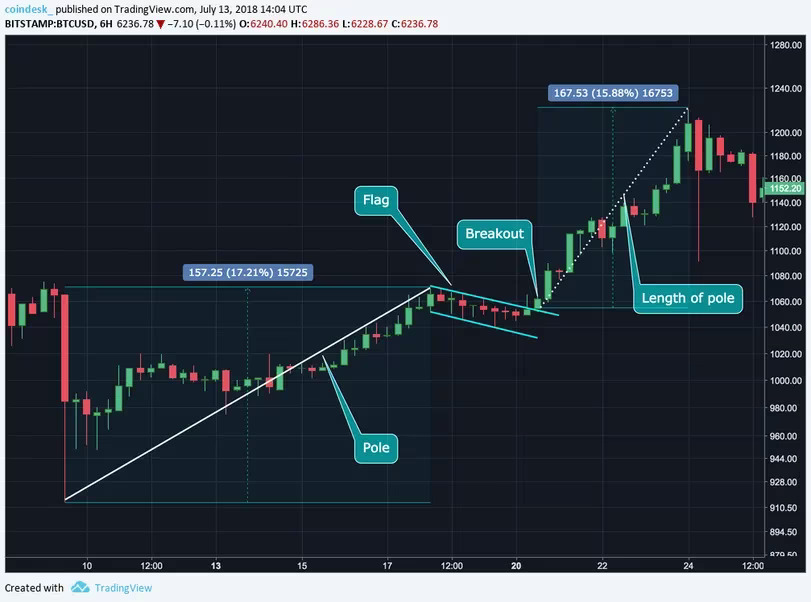
Flag patterns are continuation patterns used to identify the possible continuation of the previous trend from the point at which the price drifted in that same direction.
Flag patterns consist of three key components when it comes to crypto trading:
- Flag Pole: In a bullish market, the flagpole forms due to a significant price increase driven by strong bullish momentum, continuing until a new support level is reached. Conversely, in a bearish market, the flagpole forms due to a substantial downward trend.
- Flag Consolidation: The next component is the flag itself, characterized by parallel tops and bottoms.
- Breakout Point: It is a specific level at which the asset’s price moves either above the resistance (confirming a bullish flag) or below the support (confirming a bearish flag). When the demand exceeds the supply, the price breaks outside the flag above the resistance, and prices continue to move upwards, forming a bullish flag. On the other hand, when the supply exceeds the demand, the price breaks below the support and continues to fall, confirming a bearish flag.

Bear flag | source: link
Bull flag | source: link
Triangular (ascending, descending, symmetrical)
The triangle chart patterns for trading crypto can be categorized into three parts.
- Ascending Triangle: The ascending triangle crypto chart patterns are bullish continuation patterns. They can be identified by placing a horizontal line on the price highs, indicating the resistance level. Another component is an ascending trend line along the price lows. The ascending line signifies that the lowest prices keep increasing. Eventually, the price becomes more and more constricted. The trend breaks through the resistance, and an uptrend continues.
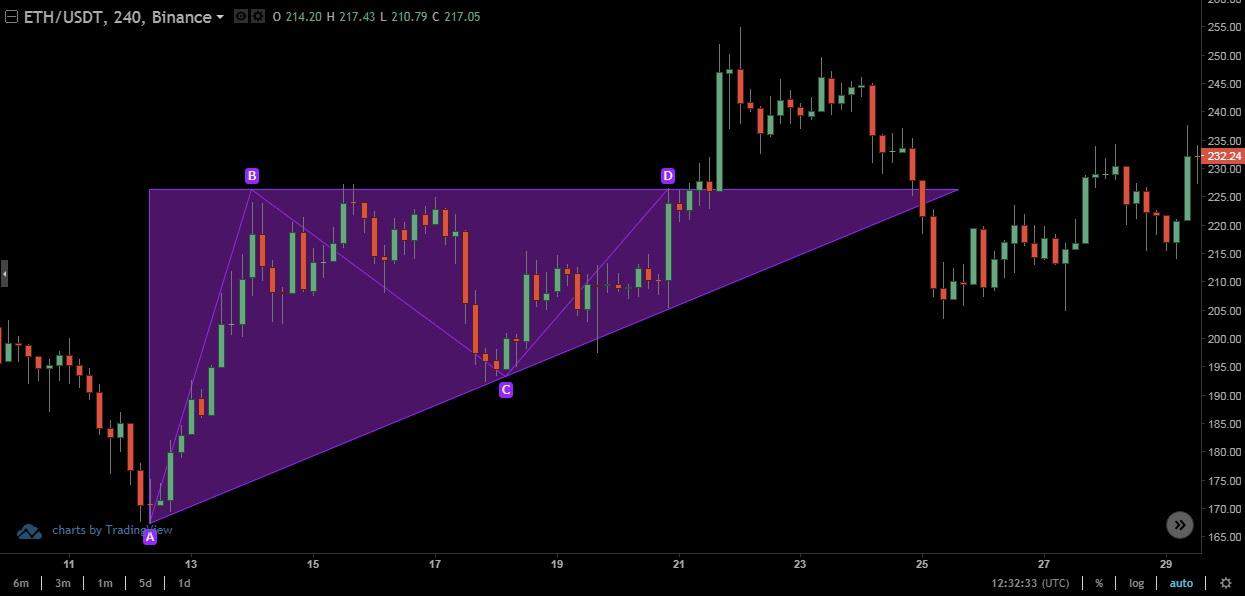
- Descending Triangle: The descending triangle chart patterns are bearish continuation patterns. They are created during the downtrend. Here, the support line is horizontal while the resistance line is descending, i.e. the higher prices keep decreasing. They keep shifting lower and eventually break through the support, continuing the prior downturn.
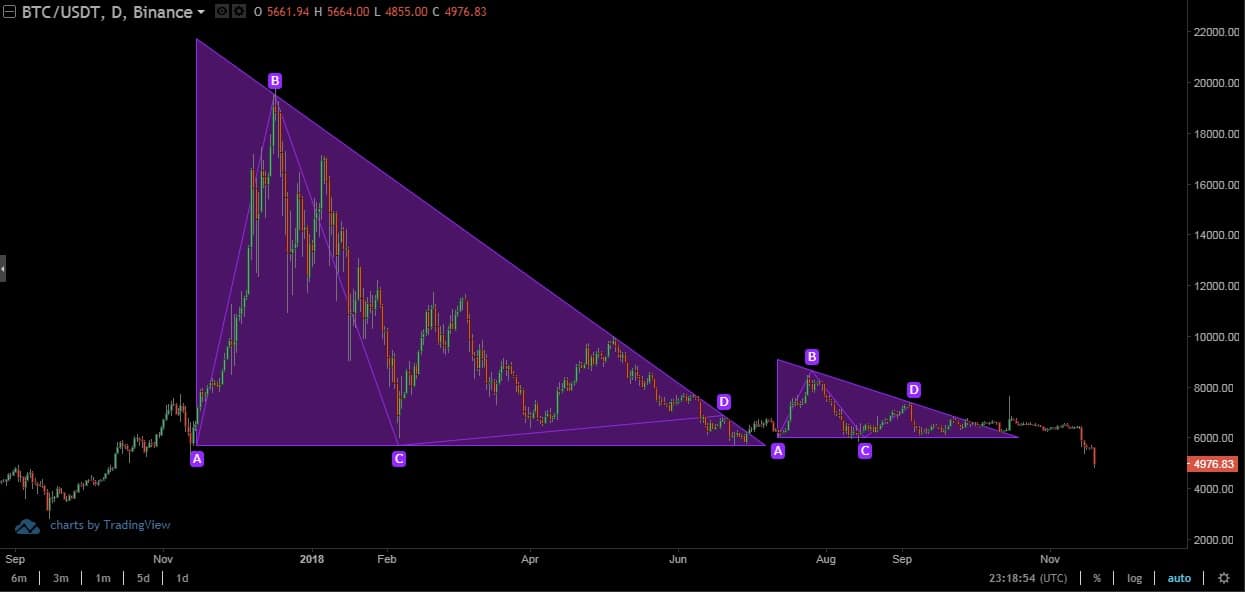
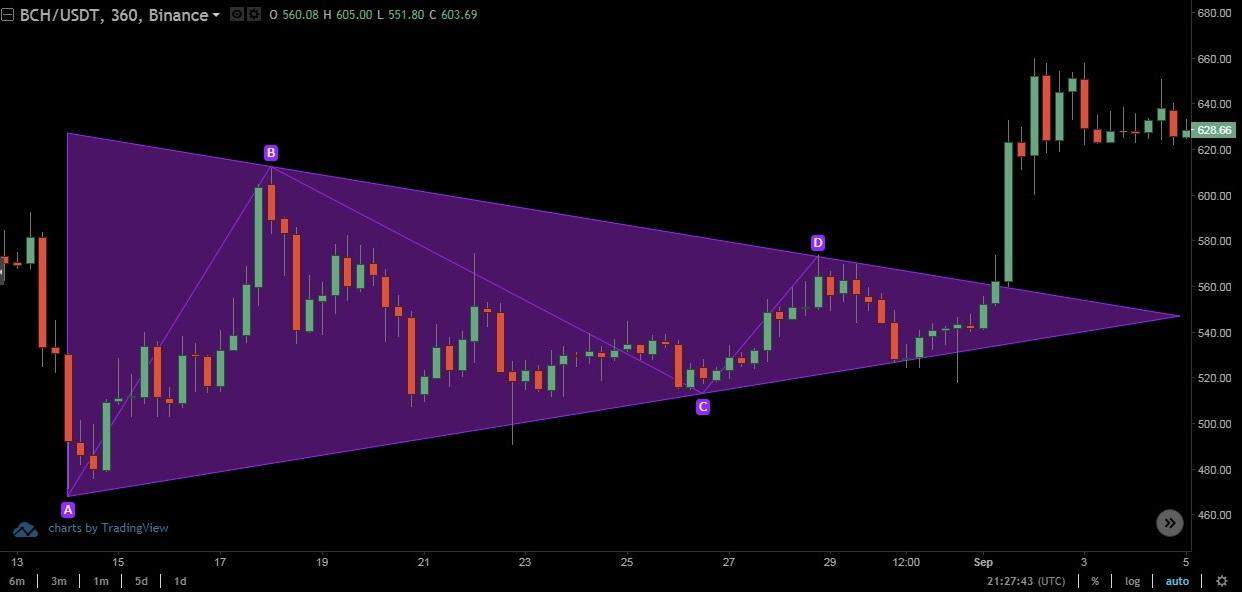
- Symmetrical Triangle: The symmetrical triangle chart patterns are developed when two trend lines converge. They can be either bullish or bearish. They signify that the market would continue in the same trend once the pattern has been formed.
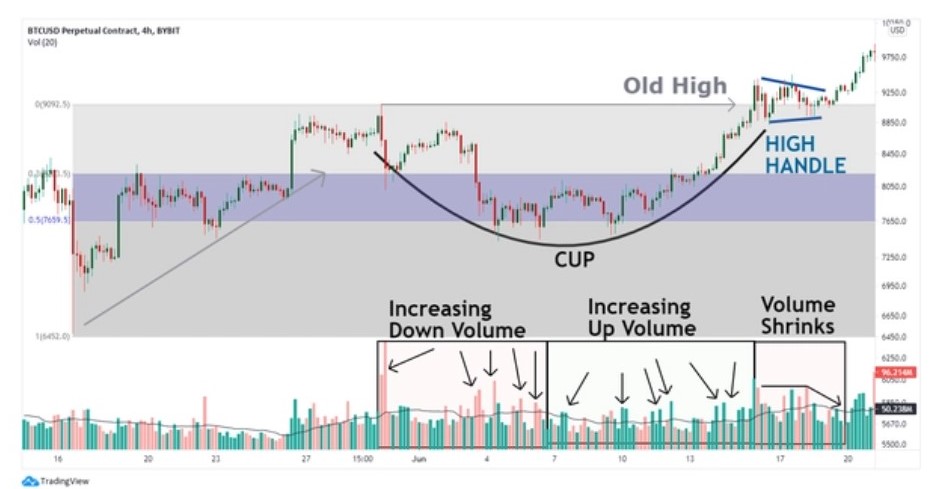
Cup and handle
The cup and handle crypto chart patterns are bullish continuation patterns in crypto trading. They indicate a short bearish market sentiment before the bullish trend continues.
It’s easy to identify a cup and handle pattern, which looks like a teacup with a handle. The cup forms when an uptrend reaches resistance, reverses direction, and moves down. The cup portion finishes when the price reaches support and reverses direction again, moving up. The handle is formed if the price moves down and reaches a higher support level, then moves up to resistance again. The price eventually breaks the resistance, and the bullish trend continues.
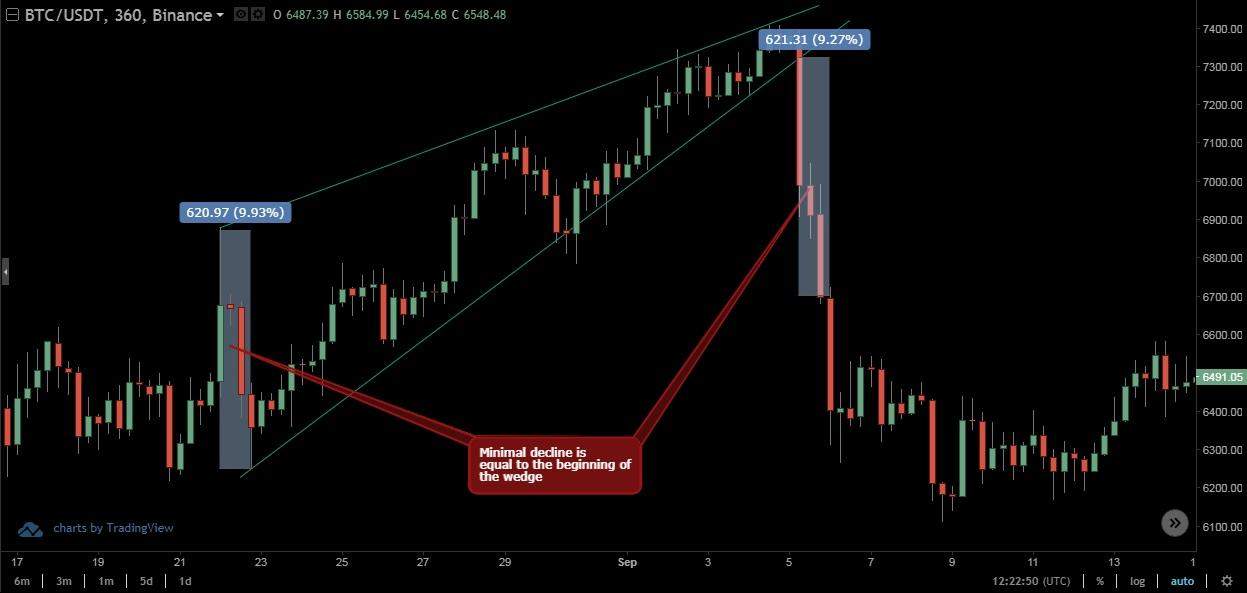
Wedge patterns (rising and falling)
Wedge crypto chart patterns come in two forms: rising and falling. Rising wedges in trading crypto indicate a bearish market while falling wedges are more commonly seen in bullish markets.
- Rising Wedge: This wedge features a trend line sandwiched between upward-sloping support and resistance lines. It typically suggests a future decline in an asset’s price, especially when it breaks below the support level.
- Falling Wedge: A falling wedge occurs between two downward-sloping lines. It often signifies a potential price increase, mainly when the asset breaks above the resistance level.
It’s crucial not to mix up wedge patterns with symmetrical triangle patterns. In wedge patterns, both trend lines move in the same direction, narrowing the price range. Conversely, symmetrical triangles involve two opposite trend lines converging, resulting in price consolidation.
Things to keep in mind before getting into crypto charts
Crypto chart patterns help investors gauge market sentiments, but are more subjective than usual technical indicators for your crypto trading strategies. For example, in the head and shoulders chart there is no compulsion that the shoulders will be of the same length. There is no particular or definite shape for any pattern. This is why, when using crypto charts for trading strategies, remember these basics:
- Don’t rely on crypto charts alone to make investment decisions.
- Set a stop loss as part of your crypto trading strategies, as chart patterns are a good indicator of where to set your stop losses.
- Crypto charts appear different for different time frames, so include time frame considerations in your decisions.
- Practice pattern recognition before forming cryptocurrency trading strategies.
- Learn to identify appropriate entry and exit times in crypto charts.
- Consider paper trading with crypto charts for practice.
Time to interpret chart patterns!
The best way to master any skill is practice! Using chart patterns in cryptocurrency trading can be a valuable skill to enhance your trading strategies. These patterns provide essential insights into potential trend reversals and continuation.
However, make sure that you use crypto charts in conjunction with other tools and strategies. Applying them thoughtfully and considering other market factors in your cryptocurrency trading decisions is crucial.
As a beginner into the world of crypto, Millionero can be your best friend! Our simplified interface makes crypto trading the easiest job, and you can even follow our experienced, top traders to copy their trades and earn profits as you learn! Visit our website to join the Millionero family today!
Further, dive into the crypto world with Millionero’s blog. Get educated, stay updated, and trade smarter. Visit our blog now!
Happy cryptocurrency trading!