
An analysis of market resilience through on-chain behavior and structural fundamentals
On-Chain Health: Cost Basis and Holder Behavior
Bitcoin’s blockchain data shows that the $93K–$98K range is more than just a chart pattern, it’s a zone deeply rooted in investor behavior and coin ownership. Glassnode’s Cost Basis Distribution Heatmap highlights a dense cluster of BTC acquired between $93K and $110K, mostly from late 2024 to mid-2025.
These holdings form a psychological and financial anchor. When price revisits these levels, most holders see little reason to sell at a loss. Instead, they tend to re-accumulate or hold, reinforcing a natural support zone.
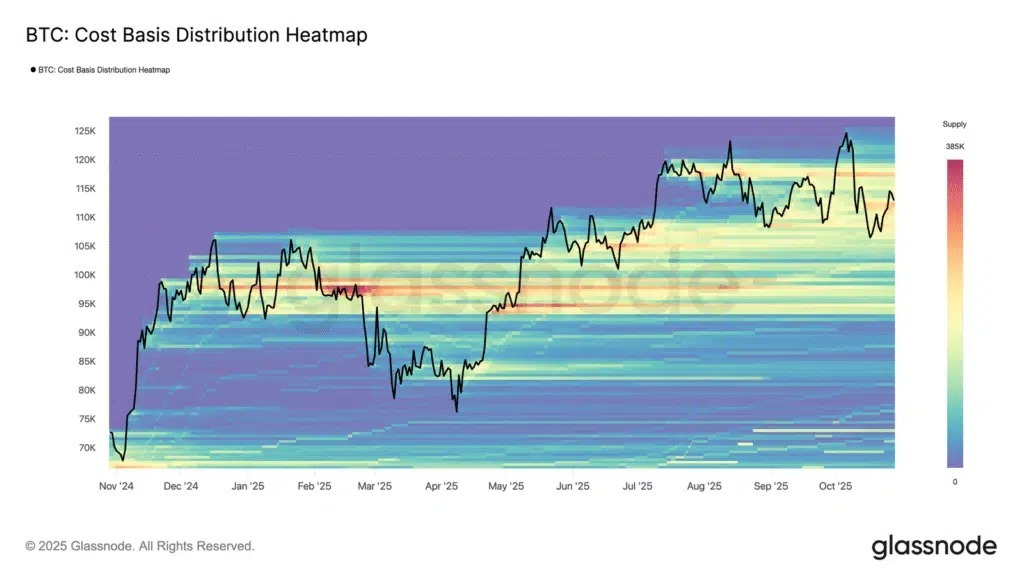
The Short-Term Holder (STH) cost basis, the average purchase price of coins held for under 155 days, has also become pivotal. By mid-2025, this metric hovered around $92K, the same level now acting as a dividing line between bullish and bearish momentum. Above it, short-term investors are in profit; below it, they capitulate. This level’s alignment with on-chain profitability makes it a live pulse of market sentiment.
Meanwhile, the Realized Price (the average cost basis of all BTC) remains far below market value, around the mid-$50Ks. Even at $92K, most holders still sit on roughly 70% unrealized profit, suggesting the market is not in distress. Long-term holders (LTHs), whose coins were last moved over 155 days ago, enjoy far larger cushions, often 400–500% profits. These participants typically sell into strength, not weakness, meaning their conviction supports the floor.
Metrics like MVRV (Market Value to Realized Value) reinforce this view. The MVRV “mean valuation band” centers near $93K, historically a level signaling market re-accumulation rather than excess. In short, dips toward $93K represent periods of healthy reset, not collapse. Similarly, Glassnode’s Net Unrealized Profit/Loss (NUPL) shows no mass panic; recent downturns pushed only a quarter of supply into loss territory, levels consistent with mid-cycle corrections, not bear markets.
Whale and Exchange Flows: Supply Leaving the Market
One of the clearest bullish on-chain signals has been exchange outflows. During recent corrections into the mid-$90Ks, more Bitcoin has left exchanges than entered. Roughly $603 million flowed out vs. $436 million in, creating a net $167 million outflow.
When coins move from exchanges to cold storage, it means investors are locking them up, reducing immediate sell pressure. This tightening of liquid supply serves as an invisible cushion beneath the market.
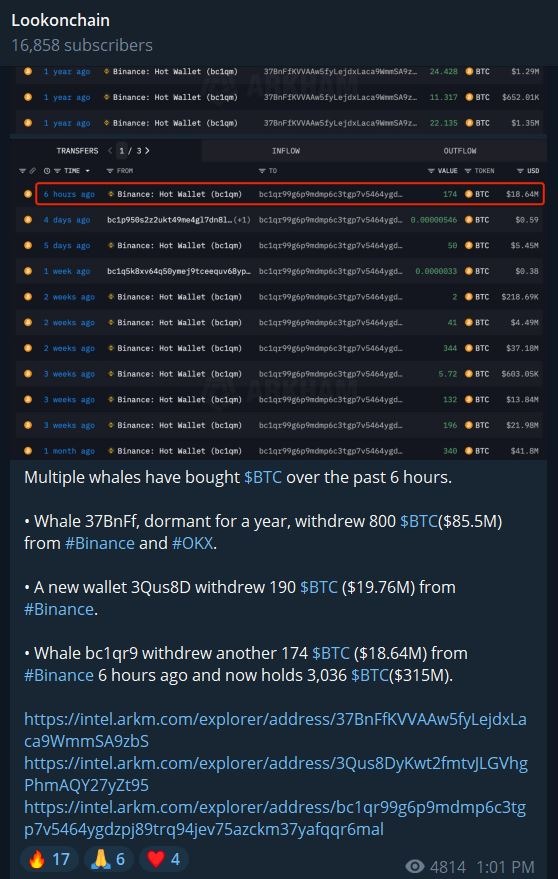
At the same time, whale wallets, those holding thousands of BTC, showed intriguing behavior. During Bitcoin’s climb to $120K+, whales distributed modestly, taking profits. But once price retraced to $100K and below, selling slowed dramatically, replaced by accumulation waves from both large and mid-sized holders.
Some dormant whales even reactivated, purchasing hundreds of BTC during dips, signaling conviction rather than fear. Combined with record-low exchange balances, this trend points to long-term storage preference over speculation.
Furthermore, derivatives data paints a similar story. Funding rates briefly turned negative as traders shorted the drop, a sign of fear, but Glassnode labeled it fragile neutrality, meaning sentiment was weak, not fundamentally bearish. Historically, such phases precede relief rallies, when pessimism peaks and smart money accumulates quietly.
Institutional Foundations: The ETF Era
Beyond blockchain data, Bitcoin’s modern fundamentals are underpinned by institutional ownership. As of late 2025, over 12% of Bitcoin’s total supply sits in regulated investment vehicles, spot ETFs, trusts, and corporate treasuries.
Major players like BlackRock, Fidelity, and ARK Invest have transformed Bitcoin from a retail-driven asset into a strategic macro allocation. These institutions tend to buy on weakness and hold through volatility, creating a stabilizing effect.
ETF inflows of $1–2 billion per week were observed at cycle peaks, absorbing supply even as long-term holders took profits. When markets cooled, inflows merely slowed, not reversed, suggesting steady structural demand. Analysts now consider pullbacks into the $92K–$98K zone as “healthy rebalancing points,” where ETFs and funds are likely to reload.
This institutional base acts like an insurance layer under Bitcoin’s price: long-term, regulated buyers continuously absorb supply, ensuring that corrections remain shallow compared to past cycles.
Miner Dynamics and Supply Discipline
Bitcoin’s supply-side fundamentals are tighter than ever. Following the April 2024 halving, daily issuance fell to roughly 450 BTC/day, cutting new supply in half. At the same time, miners’ revenues surged above $40 million/day, giving them no need to sell aggressively.
Even after selling around 15,000 BTC during the summer peak at $123K, miners quickly slowed distribution once prices stabilized around $100K. Their reserves remain high, and network hash rates continue reaching all-time highs, a clear sign that the mining industry is financially healthy.
With over 75% of Bitcoin’s circulating supply considered illiquid (held long-term or lost), the tradable float is small. This makes the market inelastic, it doesn’t take huge demand to move prices upward, nor can sellers easily flood supply. That scarcity dynamic, paired with miners’ restraint, helps define $92K–$98K as a structural floor.
Macro Tailwinds and the Broader Context
The global environment in late 2025 is gradually shifting in Bitcoin’s favor. After years of rate hikes, the Federal Reserve’s pivot to easing and renewed global liquidity cycles have reignited investor appetite for risk assets.
Bitcoin, being the hardest asset in a softening monetary world, stands to benefit.
Inflation trends are moderating, real yields are declining, and institutional analysts, from ARK Invest to Standard Chartered, are labeling Bitcoin undervalued even near $100K. Seasonal patterns also matter: Q4, historically Bitcoin’s strongest quarter, often brings rebounds after autumn corrections.

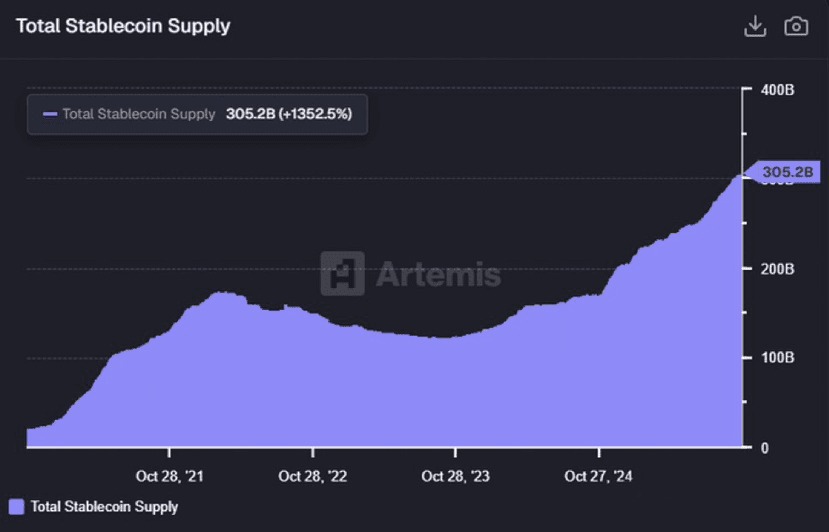
Meanwhile, stablecoin supply growth, an indicator of crypto liquidity, continues to rise following political and monetary shifts. As new capital flows into exchanges, these digital dollars become fuel for Bitcoin accumulation, especially at psychologically significant levels like $90K–$95K.
Crypto-Specific Fundamentals
Crypto-native drivers also reinforce this support zone.
- ETF expansion worldwide keeps adding long-term buyers.
- Corporate and sovereign adoption, from MicroStrategy’s continual buying to nations exploring “strategic Bitcoin reserves”, anchors demand.
- Mining and Layer-2 innovation (Lightning Network expansion, AI-powered mining) strengthen Bitcoin’s utility beyond speculation.
Even market resets, such as leveraged flushes or meme-coin slowdowns, have proven constructive, cooling excess without breaking the broader uptrend. Glassnode reports show short-term holders’ unrealized profits normalized after the summer mania, extending the bull market’s sustainability.
Conclusion: A Confluence of Strength
Bitcoin’s $92K–$98K zone isn’t just a number, it’s where on-chain behavior, institutional demand, and supply fundamentals intersect.
- On-chain, it’s where cost bases cluster and whales accumulate.
- Structurally, it’s where miners remain profitable and issuance is minimal.
- Fundamentally, it’s where institutions and macro investors see value.
This rare alignment across behavioral, structural, and economic dimensions forms one of the strongest support regions in Bitcoin’s history. Unless an unexpected shock disrupts global liquidity, the mid-$90K range is likely to serve as the foundation for Bitcoin’s next leg upward, a zone where conviction, not speculation, dominates.
As always, this isn’t financial advice, just informed insight. Do your own research before trading. For more analysis, visit blog.millionero.com. You can explore spot and perpetual trading directly on Millionero.