



The first warning came from the exits.
Before the US–Iran escalation became the loudest headline in the market, Bitcoin ETFs were already showing stress. Capital had started moving out after BTC failed near the $82,000 area, and that flow shift gave the market an early message: large investors were reducing exposure before the panic became obvious.
On May 27, Bitcoin spot ETFs recorded $733 million in total net outflows. BlackRock’s IBIT carried the heaviest pressure, with $527.8 million leaving the fund in its largest daily outflow since inception. Ethereum spot ETFs also weakened, with $67.1508 million in total net outflows. BlackRock’s ETHA saw $65.1043 million leave in a single day.
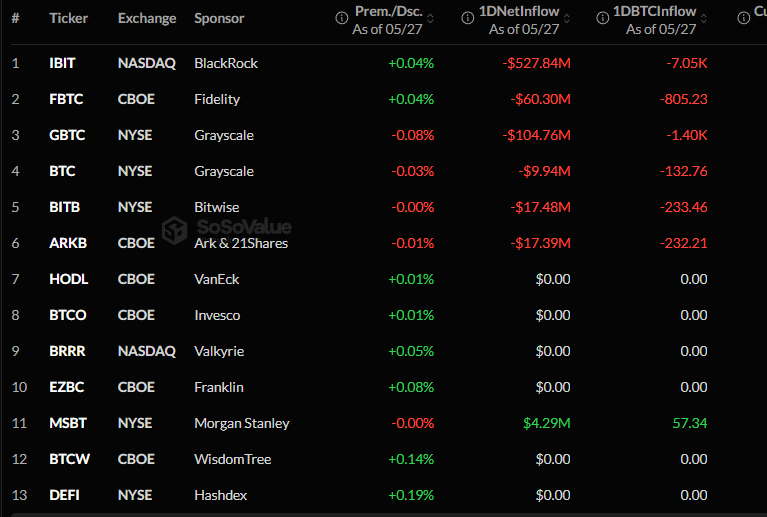
Those figures gave the market its first clean signal. Institutions had started to step back. Then geopolitics turned caution into acceleration.
Bitcoin Rejected Before the Panic Arrived
Bitcoin’s chart shows the sequence clearly. Price pushed toward $82,000, failed to extend, then started sliding lower. That rejection mattered because bulls needed strength at that level. Instead, the chart showed exhaustion.
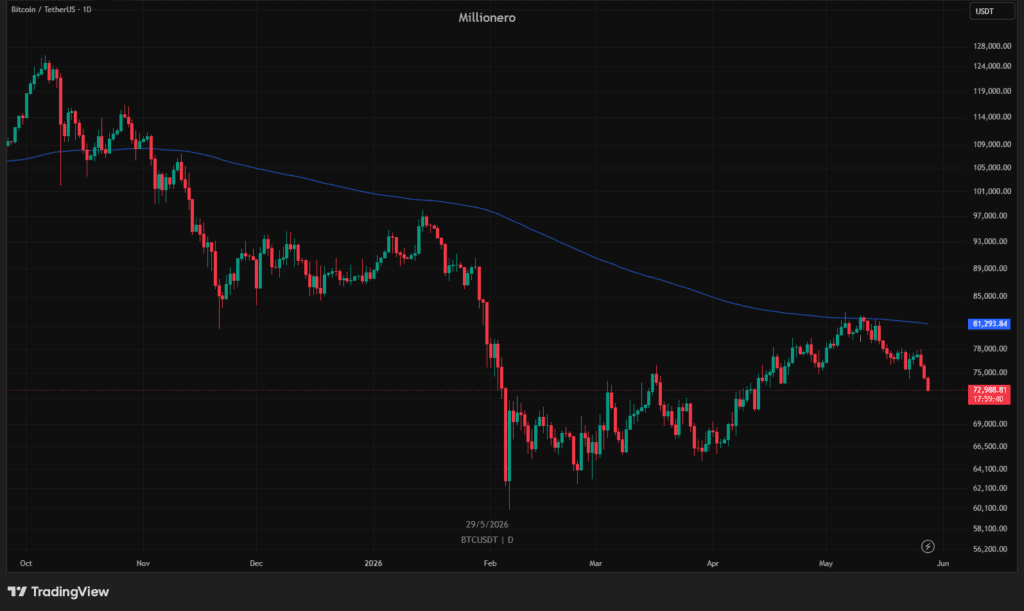
The move under a key moving average added technical pressure. A market can absorb one warning. It struggles when several warnings arrive together. In this case, Bitcoin had a failed breakout area, weakening momentum, and heavy ETF outflows at the same time.
Then the geopolitical shock landed.
After reports of US strikes near Bandar Abbas and Iranian retaliation against a US airbase in Kuwait, Bitcoin fell toward the $72,000 area. Liquidations reached roughly $1 billion, with most of the damage hitting long positions. That detail matters because many traders were still positioned for upside while larger flows had already turned defensive.
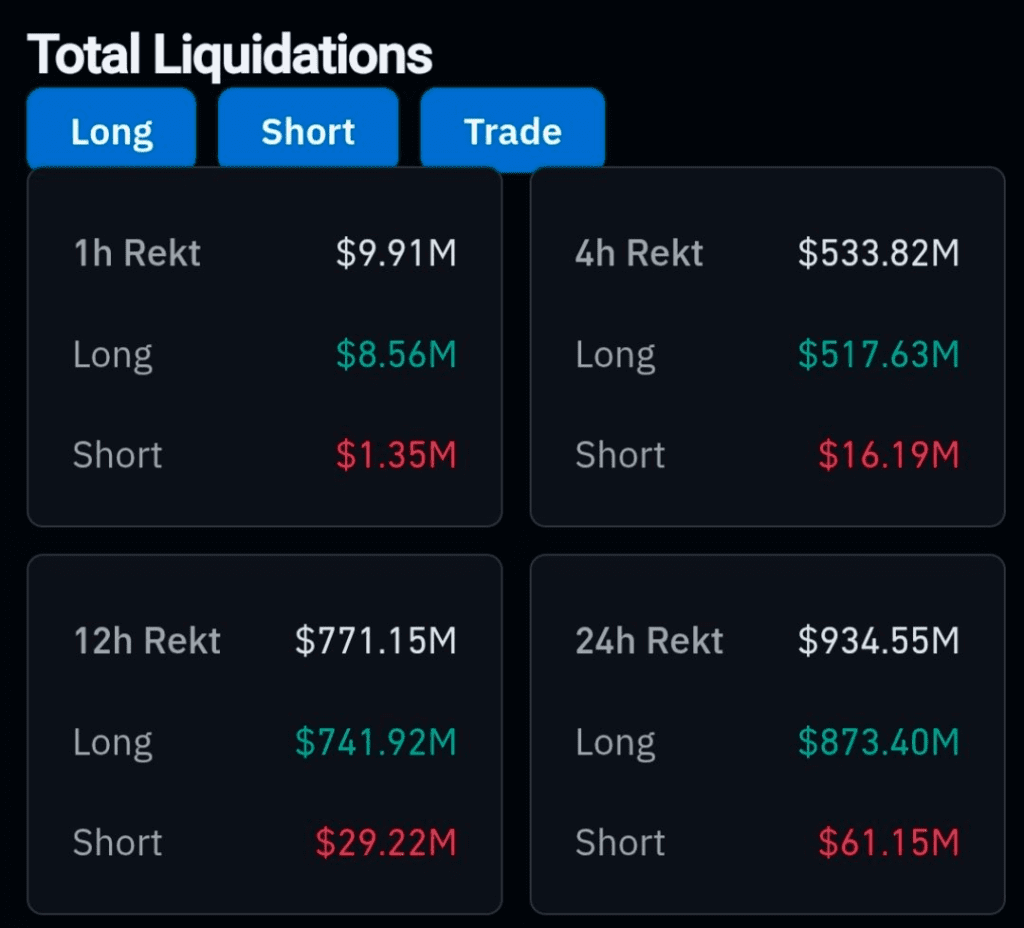
The market became unbalanced. Institutions were de-risking. Leveraged traders were exposed. The headline arrived into a fragile structure.
ETF Outflows Became the Market’s Early Alarm
ETF flows do not explain every move, but they reveal positioning. When IBIT posts its largest daily outflow since launch, the market receives a direct message from one of Bitcoin’s most important institutional channels.
This was a defensive move. Large investors had no need to wait for perfect clarity. Bitcoin had already rejected a major level. Risk assets looked vulnerable. Oil risk was rising. Global headlines were turning sharper. The exit door became crowded before the broader market fully reacted.
That is how de-risking often looks in real time. It begins quietly through flows, exposure cuts, and reduced appetite. Price confirms it later.
Asia Confirmed the Broader Risk-Off Wave
The pressure quickly moved beyond crypto. Asian markets opened deep in red, showing that the reaction belonged to the wider risk environment.
Taiwan’s stock market fell 3%, erasing around NT$3.99 trillion, or about $133 billion. South Korea’s KOSPI dropped 3%, wiping out around ₩95 trillion, or about $70 billion. Japan’s Nikkei fell 1.5%, erasing around ¥14.25 trillion, or about $99 billion.
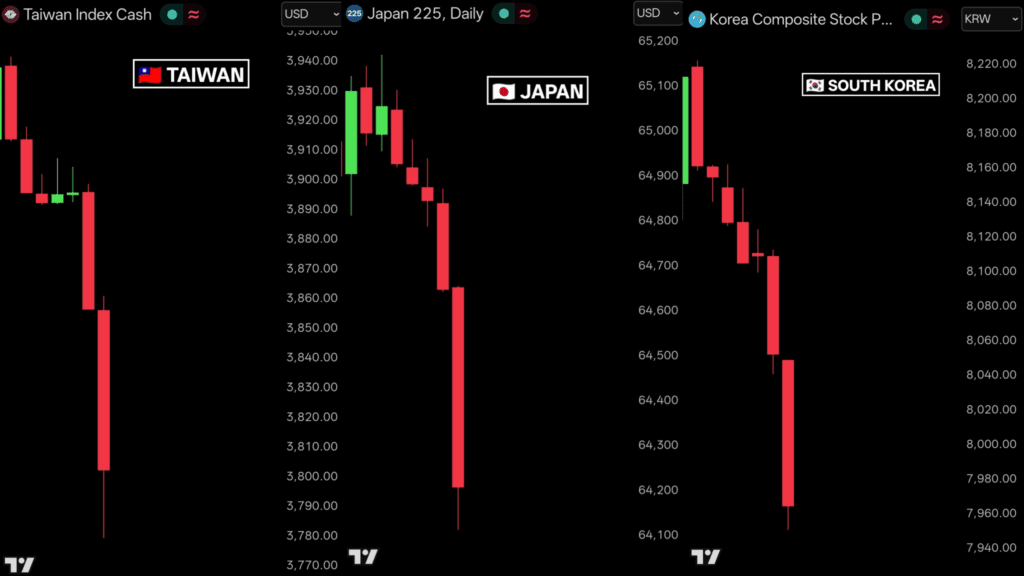
The regional selloff matters because Bitcoin behaves like a liquid risk asset during global stress. When investors cut exposure across equities, ETFs, and leveraged positions, crypto usually feels the hit quickly.
Oil added another layer. After Iran’s retaliation, oil jumped 3%, with later updates pointing closer to 5%. The Strait of Hormuz moved back into focus, and energy risk became a macro problem. Higher oil can feed inflation fears, pressure central bank expectations, and reduce confidence in risk assets.
ETH/BTC Showed Weak Crypto Appetite
The ETH/BTC chart added another warning. Ethereum continued weakening against Bitcoin, showing that traders were not rotating confidently into higher-risk crypto exposure.
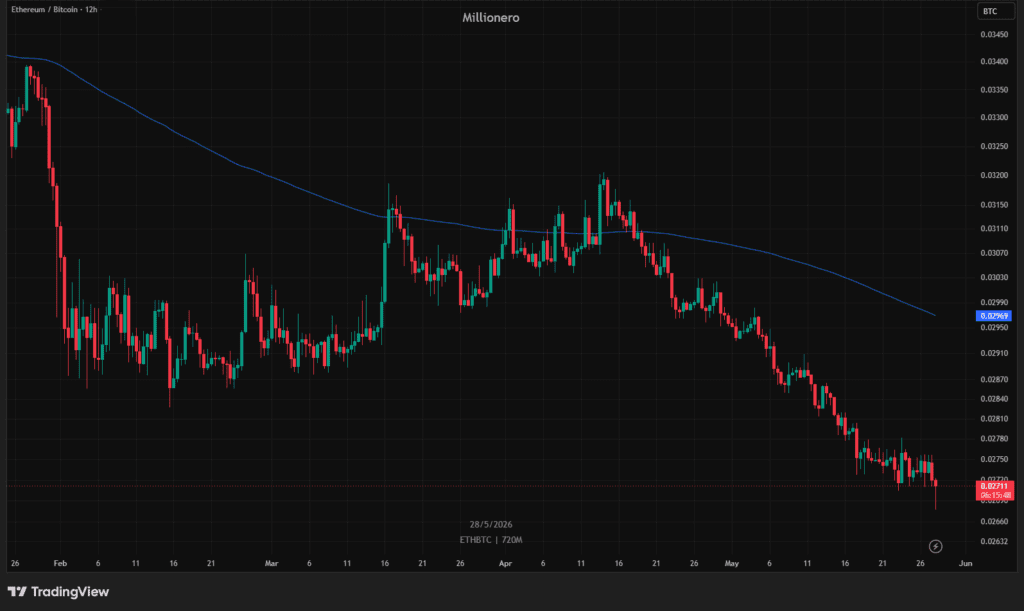
In stronger crypto conditions, capital often moves from Bitcoin into Ethereum, then into smaller assets. This time, the opposite mood was visible. The market was defensive inside crypto before the wider panic became clear.
Gold also gave an important clue. Its chart did not show a clean safe-haven breakout. That points to a messy stress event, where traders sell assets for liquidity instead of calmly rotating from risk into safety.
The Exits Spoke First
Bitcoin’s drop makes the most sense as a sequence. First came the rejection near $82,000. Then came heavy ETF outflows. ETH/BTC weakened. Asian markets sold off. Oil jumped after the US–Iran escalation. Liquidations turned pressure into speed.
The lesson is simple: the exits spoke before the headlines screamed. Institutions had already started to de-risk through ETFs, and the geopolitical shock pushed an already fragile market into a sharper reset.
For now, the market’s next direction depends on three signals: whether ETF outflows slow, whether oil stabilizes, and whether Bitcoin can rebuild strength after losing momentum. Until then, caution remains the main language of the chart.
This article is for educational purposes only and should not be taken as financial advice. Always do your own research before making trading or investment decisions. For more market education, visit the Millionero Blog, and explore crypto trading through Millionero Exchange.