
The MVRV Ratio is one of the most powerful on-chain metrics, but retail traders rarely use it. In this article, we’ll explore MVRV’s use cases related to Bitcoin prices, identifying trends, spotting cycle tops and bottoms, and recognizing warnings of heavy selling pressure.
David Puell and Murad Mahmudov, on-chain pioneers, introduced the MVRV Ratio in October 2018. It serves as a macro oscillator that helps explore Bitcoin’s market cycles and spot tops and bottoms.
Understanding MVRV Ratio
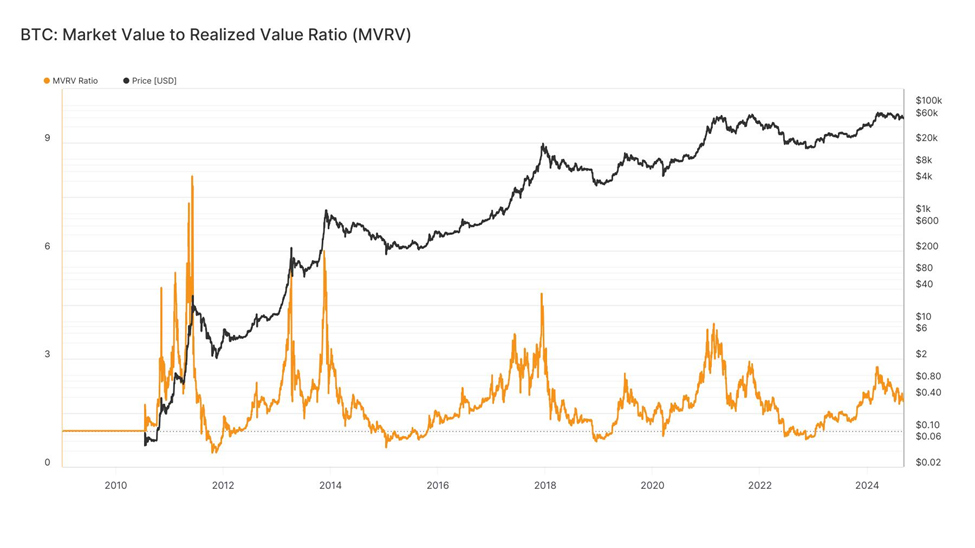
MVRV stands for Market Value to Realized Value. This metric measures the ratio between Price and Realized Price. The Realized Price reflects the average price at which the market last bought or moved all Bitcoin in circulation on-chain. Essentially, MVRV gauges Unrealized Profit within the circulating supply.
- An MVRV of 2.2 means the Price is 2.2 times the Realized Price (120% Profit 🙂 ).
- An MVRV of 1.0 means the Price is equal to the Realized Price (zero-sum 😐 ).
- An MVRV of 0.8 means the Price is 0.8 times the Realized Price (20% loss 🙁 ).
The chart below illustrates euphoric periods of extreme unrealized profit and dreadful periods of extreme unrealized loss, as shown by the MVRV Ratio.
- High MVRV Values (>2.4) ↗️ indicate the market holds large unrealized profits.
- Low MVRV Values (<1.0) ↘️ indicate the market holds unrealized losses.
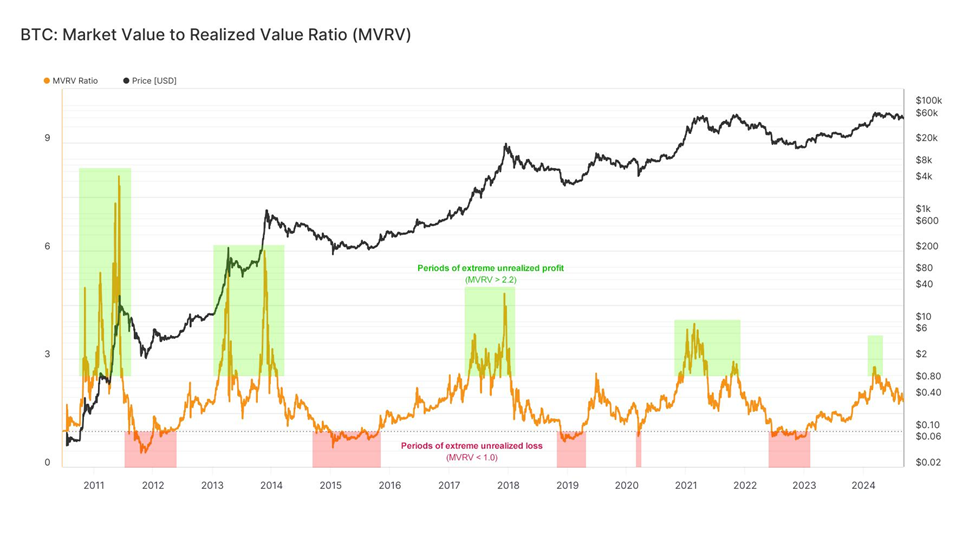
To calculate the average profit percentage held by the market, use the formula MVRV – 1.
Periods when MVRV is below 1 highlight that the average Bitcoin holder is underwater, with the average coin acquired above the current spot price. These events are uncommon and typically occur during the later stages of prolonged bear markets. Such significant unrealized losses often lead to wide-scale capitulation events, historically associated with cycle lows.

Exploring Extreme Values
What defines high or low MVRV values? How can we measure extreme deviations associated with cycle tops and bottoms?
A visual guide marks out MVRV levels at 0.8 🔵, 1.0 🟢, 2.4 🟠, and 3.2 🔴, which align well with tops and bottoms. However, a more robust analysis is necessary beyond just eyeballing these levels.

A straightforward approach involves calculating the proportion of days in history when MVRV has traded below or above these levels. This calculation considers dates since 2017, reflecting a more mature Bitcoin market. For example, if MVRV has been below a particular level for 10% of trading days, it has been above it for the remaining 90%, making that scenario more likely.
Here’s the likelihood of breaching these MVRV levels:
- Extreme Lows: MVRV has been below 0.8 for around 5% of trading days.
- Getting Low: MVRV has been below 1.0 for around 15% of trading days.
- Getting High: MVRV has been above 2.4 for around 20% of trading days.
- Extremely High: MVRV has been above 3.2 for around 6% of trading days.

By charting periods when MVRV is above or below these key levels, we can begin to identify cycle tops and bottoms.
- Cycle Lows typically form if MVRV is below 0.8 (~5% of trading days below).
- Capitulation Starts when MVRV is below 1.0 (~15% of trading days below).
- Euphoria Starts when MVRV is above 2.4 (~20% of trading days above).
- Cycle Peaks typically form if MVRV is above 3.2 (~6% of trading days above).

Identifying Key Pricing Bands with MVRV
These defined ‘extreme levels’ can be visualized as pricing bands. For example, if the MVRV Ratio equals 2.4, the corresponding pricing band is 2.4 times the Realized Price. This tool estimates price levels where the market might reach extreme unrealized profit (high values) or unrealized loss (low values). Reaching these prices increases the likelihood of investor behavior, such as profit-taking or capitulation, which ultimately establishes the cycle top or bottom.

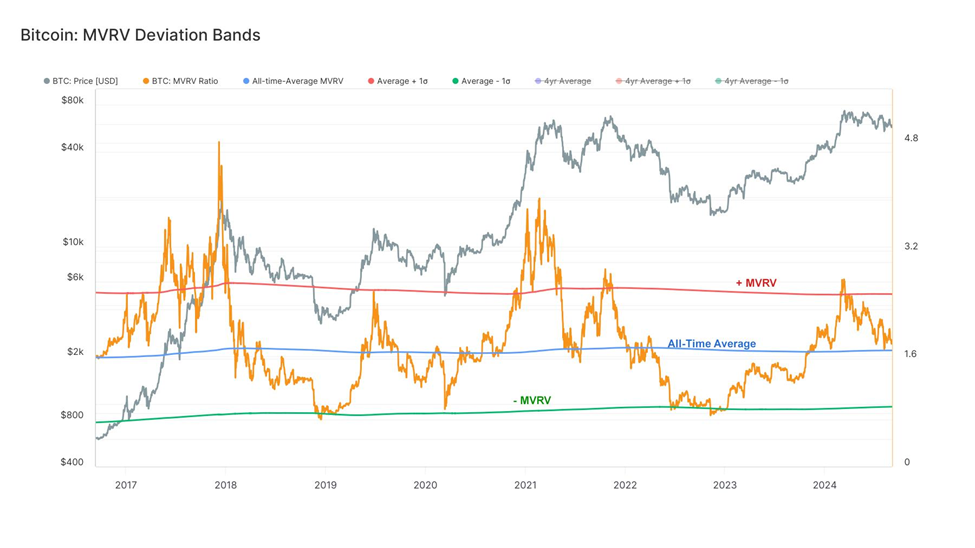
A more advanced and statistically robust approach could involve calculating the all-time average MVRV and using ±1 standard deviation bands to spot extremes. This method offers a more statistically significant analysis.
MVRV Momentum: Tracking Macro Trends
The previous section explored using MVRV to identify cycle extremes. Now, we’ll use it to track macro market trends. The chart below shows the Ratio alongside the 1-year simple moving average (SMA). Periods when MVRV trades above the 1-year SMA typically describe bull markets, while periods below describe bear markets. Cycle transition points often feature it breaking strongly across the 1-year SMA threshold:
- ⬆️ Strong Breaks Above indicate large volumes of BTC were acquired below the current price and are now in profit (describing heavy accumulation near the lows).
- ⬇️ Strong Breaks Below indicate large volumes of BTC were acquired above the current price and are now in loss (describing heavy distribution near the top).

We can create an oscillator by taking the ratio between MVRV and the 1-year SMA. This tool helps spot sharp transitions at cycle turning points.
- 🐻 Start of the Bear: Sharp declines (negative values) indicate that lots of coin volume was acquired at higher prices and has fallen into a loss, suggesting a ‘top-heavy’ market sensitive to price declines.
- 🐂 Start of the Bull: Sharp increases (positive values) suggest that lots of coin volume was acquired at lower prices and is back in profit, indicating a ‘bottom-heavy’ market following heavy capitulation into accumulation.

Distribution Divergences: Advanced Warning Signals
The Ratio also provides advanced warnings when heavy distribution occurs, often near market cycle tops, on both macro and micro scales. For instance, during the 2020-2023 cycle, prices in October-November 2021 reached a higher ATH compared to April, but the MVRV peak was significantly lower.
Why was the price higher but the aggregate unrealized profit multiple lower? The answer lies in the fact that the average coin had a higher acquisition price in November compared to April. This created a macro-scale negative divergence in the Ratio.
During the July-November rally, many coins acquired at cheaper prices during the May-July sell-off were sold off, transferring to newer, less experienced ‘top buyers’. Coins revalued from cheap realized prices were handed to speculators and price-sensitive buyers with a much higher cost basis closer to the ATH.

The chart below shows this phenomenon in two metrics:
- Realized Profits: In October-November, realized profits reached around $1.5B per day, as coins acquired at cheaper prices transferred to new buyers at higher prices.
- The Realized Cap: This metric experienced a second leg higher due to profit-taking behavior. The 2022 bear market created a downtrend in the Realized Cap, locking in losses and returning to July levels. This flushed out speculative premiums added between July and November 2021.

A similar negative divergence appears between January-May 2021 peaks on a smaller scale. While the price set new highs, MVRV decayed to lower highs. This trend indicates large-scale distribution and profit conversion from unrealized to realized.

We observe a similar event between the double peaks in 2013, where prices rallied 392%, yet the ratio fell from 5.74 to 5.43. In green, there was a similar micro-scale decay right before the ultimate peak at $1,133.

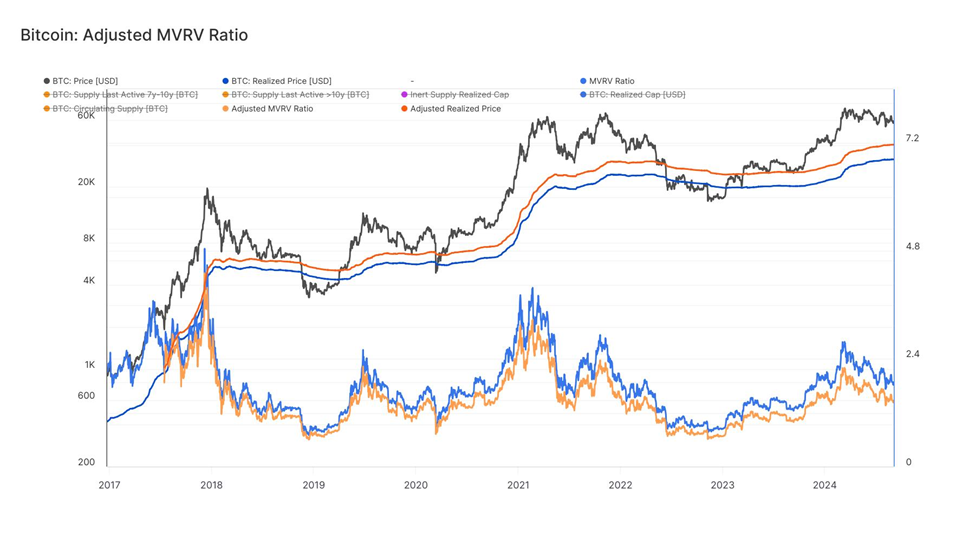
Adjusting for Lost Coins
MVRV is inherently biased upward due to unrealized profits held by Satoshi, early miners, and lost coins. To account for lost coins, one method is discounting coins unspent for at least seven years. The chart below calculates Adjusted-MVRV, subtracting unrealized profits from long-dormant coins. This adjustment results in a higher Adjusted-Realized Price, reflecting the average acquisition price of ‘alive supply’, yielding a lower Ratio (smaller profit multiple) and providing a clearer view of the liquid and mobile coin supply.
Conclusion
The MVRV Ratio is an essential tool for understanding Bitcoin’s market dynamics, yet remains underutilized by retail traders. By analyzing it we can identify critical moments when Bitcoin hits cycle tops or bottoms and anticipate major market shifts. This metric, pioneered by David Puell and Murad Mahmudov, offers insights into the unrealized profit or loss in the market and allows for precise tracking of momentum shifts.
Bitcoin operates in cycles, and MVRV quantifies these, providing clear signals when euphoric highs or capitulatory lows approach. This tool isn’t just theoretical; it’s proven for navigating Bitcoin’s unpredictable market behavior. In an era where data analytics provides an edge, mastering it is essential for anyone serious about understanding Bitcoin’s future. Dive deep into the data and take control of your financial destiny.
For more insights on Bitcoin and crypto market trends, visit Millionero Blog.
All resources are sourced from Glassnode on-chain analytics.