The Week the Middle East Changed Everything
It was the kind of week where geopolitics did not just brush against financial markets, it crashed straight through them. The US and Israeli military campaign against Iran’s nuclear infrastructure set the tone from Saturday onward, sending shockwaves across oil markets, global equities, currencies, and crypto. Every other story this week, Bitcoin’s bounce, Ethereum’s staking queue, institutional moves, regulatory headlines, unfolded inside the shadow of that conflict.
For anyone trying to understand where markets are heading, you cannot separate the price charts from the battlefield developments. This week made that clearer than ever.
Geopolitical Escalation: The Week’s Defining Story
The War Expands and the Strait Becomes a Flashpoint
The week opened with Iran formally announcing its intention to close the Strait of Hormuz. The declaration was unambiguous: “We will not allow oil to leave the region.” That single statement was enough to rattle energy markets globally. Roughly 20 percent of the world’s oil supply passes through that narrow waterway, and for China, which sources approximately 45 percent of its oil imports through it, the threat carried immediate economic weight.
The US State Department issued emergency departure orders for American citizens in multiple Middle Eastern countries, citing “serious security risks.” Airlines responded in kind, with 41 percent of scheduled flights to the region cancelled. European gas prices surged 50 percent in a single session after Qatar, which supplies 18–20 percent of global LNG trade, halted production following an Iranian drone strike.
Iran also launched what was described as one of its largest-ever missile barrages against Gulf states. The intercepted results varied by country: Qatar neutralized roughly 97 percent of incoming threats, the UAE handled 93 percent despite facing the heaviest volume at 871 total threats, and Kuwait, Jordan, and Bahrain also reported high interception rates. The region held, but the scale of the attack signaled a conflict that had moved well beyond warning shots.
The US-UK Tension and Allied Divisions
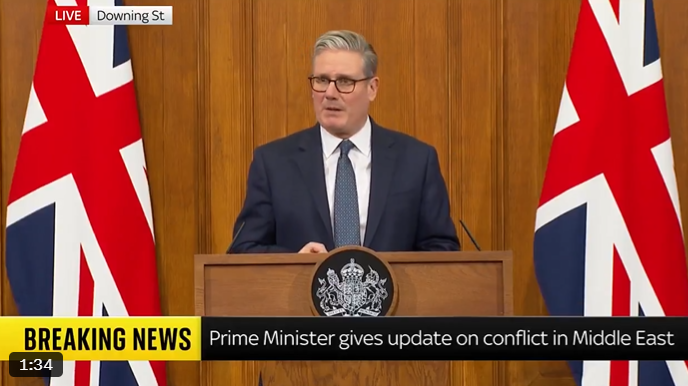
Friction within the Western alliance added another layer of complexity. UK Prime Minister Keir Starmer publicly defended his decision to keep Britain out of the initial offensive strikes, framing it as “calm and measured leadership in the national interest.” US President Trump had criticized the decision, and tensions escalated further after the UK was slow to authorize US use of its military bases in the region. Reports also emerged that Spain blocked American access to its bases, with US aircraft observed relocating toward Germany and France.
US Vice President Vance made the American position clear: Trump would not stop until Iran was denied a nuclear weapon. The message was directed as much at allies as at Tehran.
Iran’s Contradictory Signals
Midweek, the Iranian Deputy Foreign Minister stated publicly that Tehran was willing to abandon its nuclear program in exchange for a satisfactory alternative offer from Washington. Almost simultaneously, Ali Larijani published a blunt counter-message: “We will not negotiate with the United States.” These contradictory signals created exactly the kind of uncertainty that derivatives markets hate, and in both equities and crypto, the whiplash was visible in real time.
The New York Times reported that Iran had made a “secret” back-channel offer to the US to negotiate an end to the war. Reported terms included abandoning ballistic missile and nuclear programs, ending support for regional militias, and accepting a framework loosely modeled on the “Venezuela approach” previously used in diplomatic negotiations. US stock futures surged on the report. Whether the offer was serious or tactical remained unclear, but markets moved first and asked questions later.
Oil, Energy, and the Macro Fallout
Brent Crude Pushes Past $82
Brent crude traded above $82.50 per barrel by mid-week, and Goldman Sachs warned that if the Strait of Hormuz remained closed, prices could climb another 30 percent toward $100 per barrel. That forecast, combined with live disruptions to Gulf shipping lanes, pushed energy costs sharply higher across the board. Gasoline prices had already risen roughly 20 percent since January.
The downstream effects were spreading fast. Japan’s oil refiners formally requested that the government release reserves from the national strategic stockpile, citing direct supply constraints from the Middle East war. China, simultaneously, ordered its largest refineries to halt diesel and gasoline exports in order to protect domestic supply. A tanker explosion near Kuwait, accompanied by a reported oil spill, added further uncertainty to an already-strained shipping environment.
China moved diplomatically to protect its energy supply, entering talks with Iran aimed at securing safe passage for oil and gas vessels through Hormuz. With nearly half of China’s crude imports flowing through that strait, Beijing had strong motivation to push Tehran toward restraint, a dynamic that complicated the diplomatic picture for Washington.

Macro Repricing in Europe and Beyond
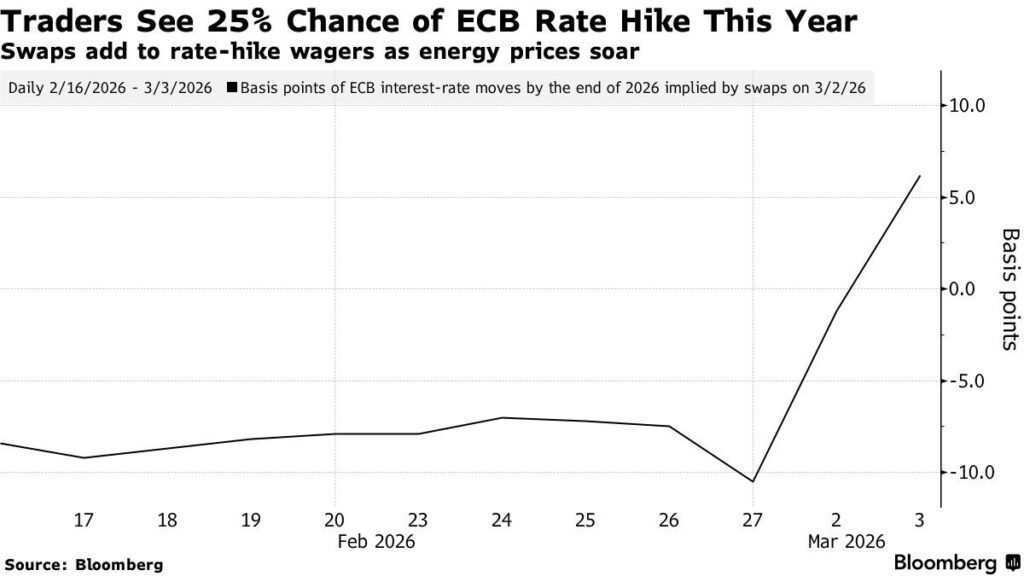
The energy shock was already feeding into European rate expectations. Where markets had anticipated further interest rate cuts from the ECB by year-end, positioning shifted dramatically. Probability models began assigning a 25 percent chance of a rate increase by year-end, driven by fears of an inflationary energy shock through LNG prices. The ECB was suddenly facing the same uncomfortable dilemma central banks dread: slowing growth on one side, rising energy-driven inflation on the other.
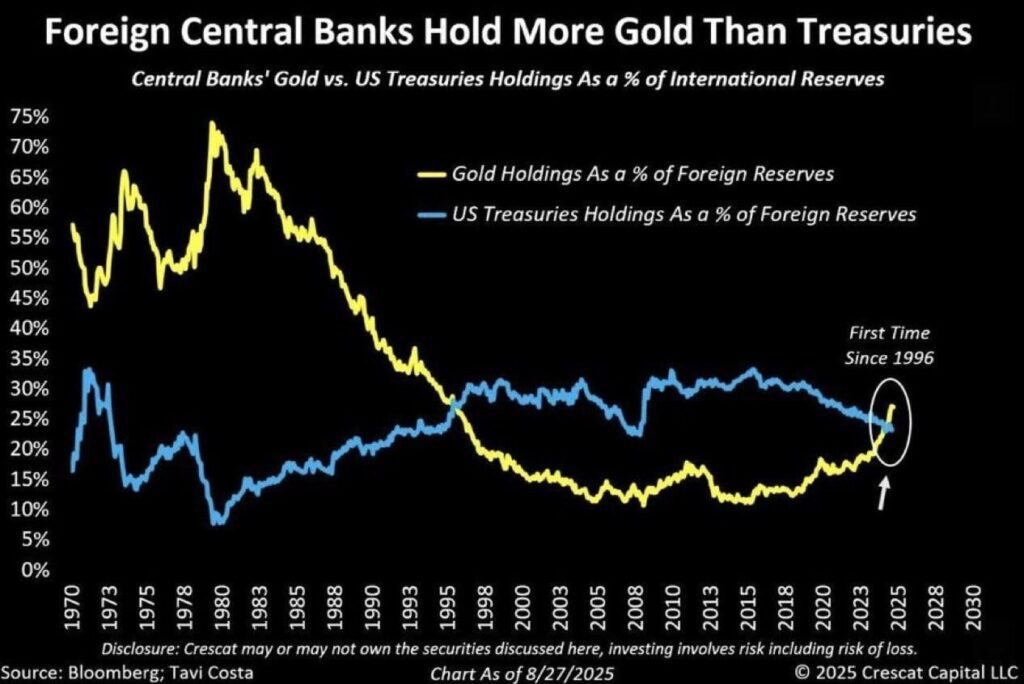
On the reserve side, a structural shift drew significant attention. Foreign central banks now hold more gold than US Treasuries for the first time in approximately 30 years, a rebalancing of global reserve portfolios that speaks to the longer-term erosion of dollar-denominated debt as the world’s default safe asset.
Bitcoin: The Bounce, the Rejection, and the Unresolved Question
From $63,000 to $74,000 and Back
Bitcoin’s week was shaped directly by the war. When US and Israeli forces struck Iran on Saturday, March 1, Bitcoin was sold hard, dropping to near $63,000 as traders fled to liquidity. The move fit a pattern that has become familiar: in a sudden geopolitical shock, Bitcoin behaves not like digital gold but like a liquid risk asset, something traders sell first when they need cash fast.
The recovery from that low was significant. By Wednesday, March 5, Bitcoin had climbed back above $74,000, a roughly 15 percent bounce in five trading days. The move was powered by several converging forces: strong inflows into spot Bitcoin ETFs, which recorded days of $458 million, $225 million, and $461 million in consecutive sessions, combined with aggressive short covering in derivatives markets. Bearish traders who had built leveraged short positions got squeezed as price moved against them, adding fuel to the upside momentum.
The critical detail, however, is what happened next. Bitcoin failed to hold $74,000. And it failed at a technically meaningful cluster: the 61.8 percent Fibonacci retracement of its broader downward move, and just below the 50-day moving average. These are precisely the levels where bear market rallies tend to exhaust themselves, where overhead supply from traders looking to exit at break-even overwhelms incoming buyers.
Why the Rally Stalled
The rejection was not random. Bitcoin had tested the $71,500–$73,000 resistance zone multiple times during the week, and each attempt showed weakening momentum. The final push printed a lower high before reaching the ceiling, a classic sign that buying pressure was fading before it even reached the target. Short sellers began leaning on the level with more confidence as the pattern repeated.
Compounding the technical picture, the macro backdrop remained hostile. Global equities were under pressure throughout the week, with Asia’s benchmark index down more than 6 percent since the war began, on pace for its worst week since March 2020. The US dollar surged, posting its strongest weekly performance since November 2024. Oil’s weekly move was the biggest since 2022. Rising oil feeds directly into inflation expectations, which pushes bond yields higher, which tightens financial conditions, which hurts risk assets. Bitcoin, tightly correlated with Nasdaq-style risk assets, was caught in that current.
By Friday, Bitcoin had pulled back to around $70,700, giving up roughly a third of the week’s rebound. The $70,000 level, which had been resistance for most of the prior month, was now the immediate test of support. A clean hold there would be the bulls’ minimum requirement. A break lower would expose $64,000 as the next significant downside reference.
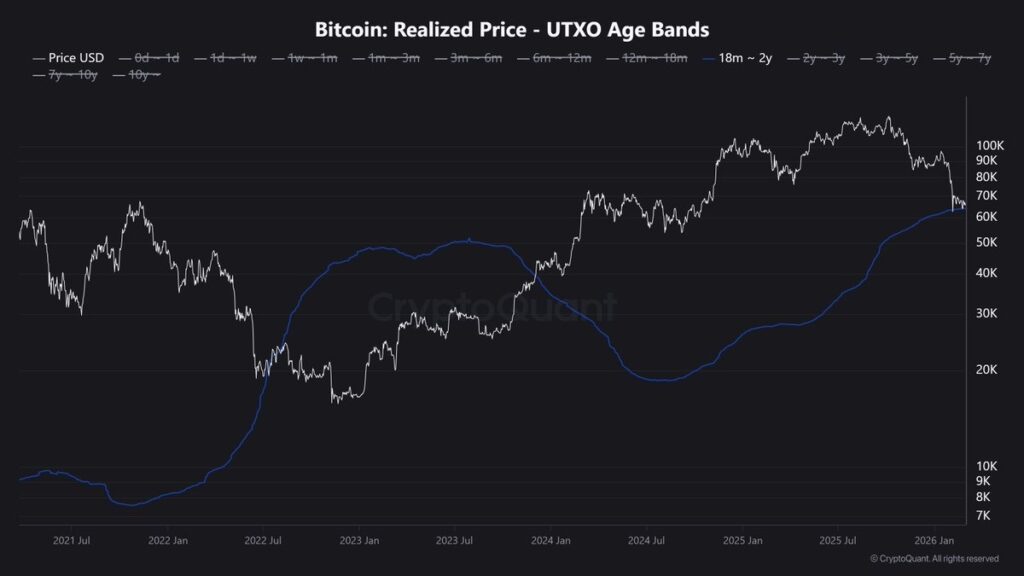
The Structural Picture
Even in the context of the bounce, the broader trend remained under pressure. Investors who bought Bitcoin in the 18-to-24-month range were now sitting at a loss for the first time in over two years, a development tracked by on-chain cost basis data.
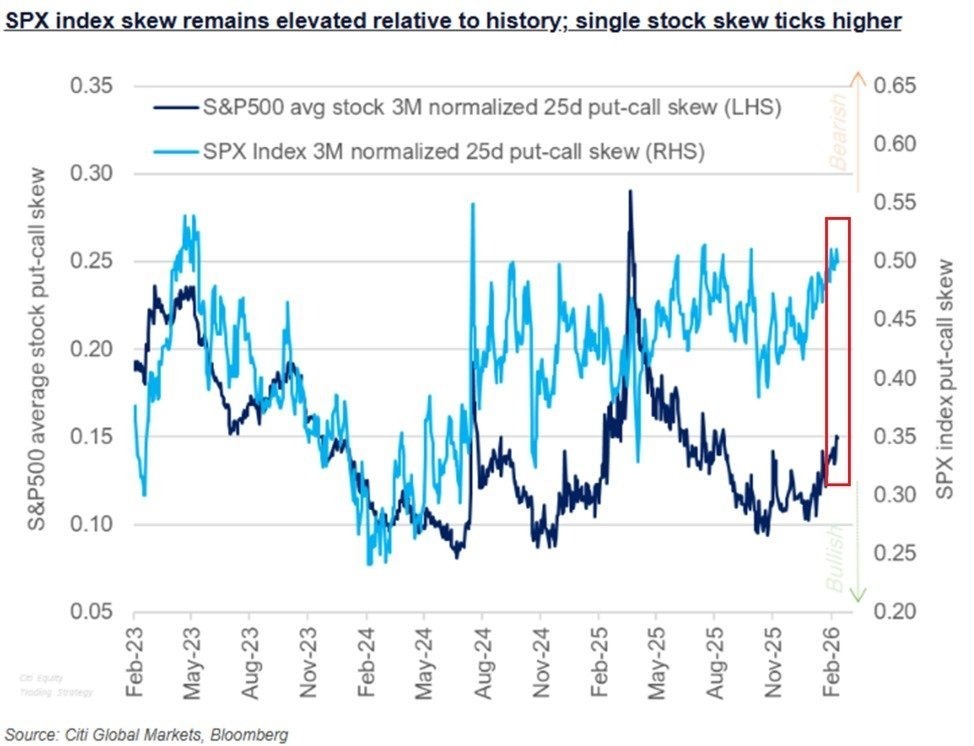
The options market told a similarly cautious story: the 3-month put-call skew on S&P 500 options reached close to a three-year extreme in favor of puts, reflecting peak hedging activity in equities that typically bleeds into crypto sentiment. Options traders in Bitcoin itself remained skewed toward downside protection despite the week’s rebound.
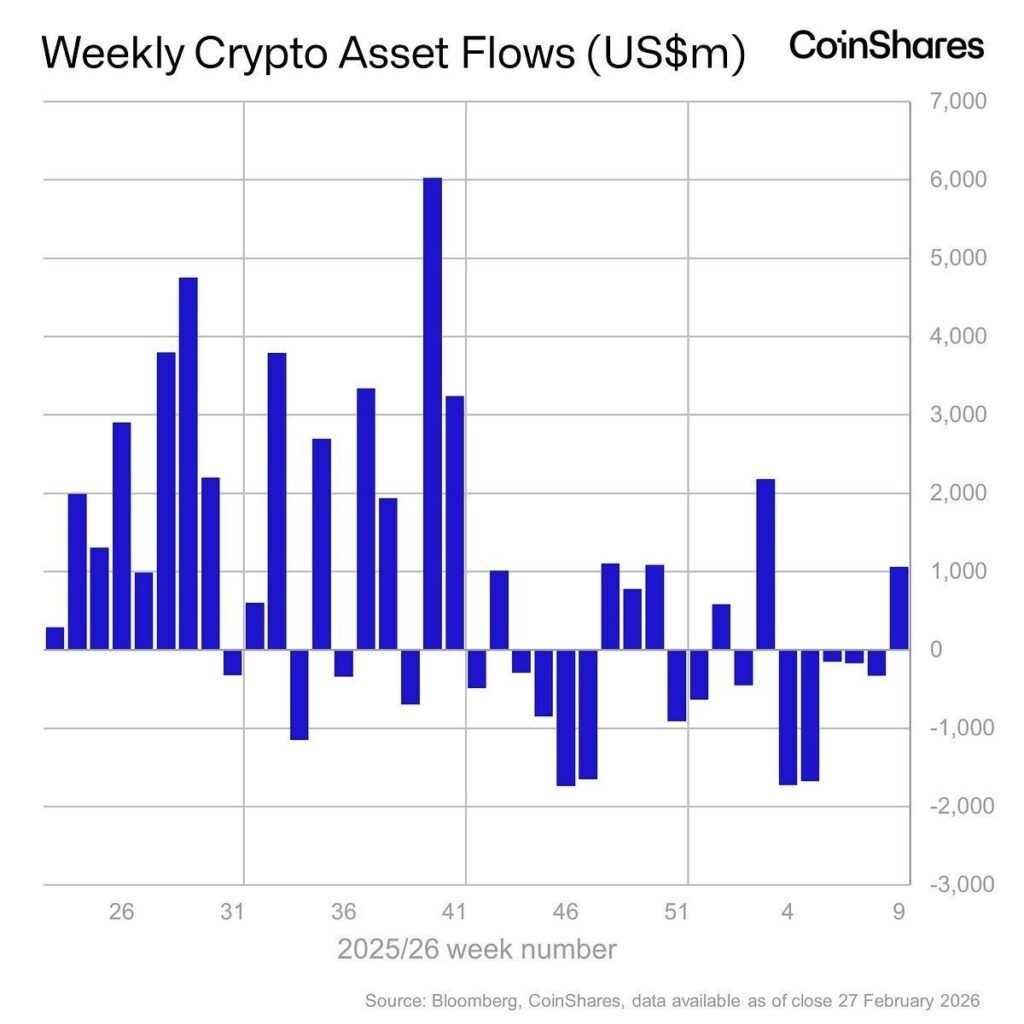
The context worth holding onto: Bitcoin entered March down five consecutive months from its October 2025 peak. ETF outflows had totaled more than $4 billion over five weeks before last week’s $1 billion reversal. February’s correction brought losses of nearly 15 percent. The framework of a recovering market requires more than a single good week, and the war introduces a sustained macro variable that cannot be timed with precision.
One data point offering modest encouragement: the VanEck chairman noted that Bitcoin appeared to be “forming a bottom,” calling it “a very good sign of life.” Whether that reads as a genuine structural inflection or as guarded optimism inside a still-uncertain environment is, ultimately, the question the next few weeks will answer.
Ethereum, Altcoins, and Market Positioning
Ethereum’s Staking Queue Hits a New Extreme
One of the more technically notable developments of the week involved Ethereum. Approximately 3.4 million ETH was queued to enter the validator set, one of the longest staking wait queues since Ethereum’s transition to proof-of-stake. The volume of demand appears to be driven largely by institutions and large platforms seeking yield on their ETH reserves. For context: this represents meaningful capital that has decided to commit to Ethereum long-term rather than remain liquid. The signal is constructive, even if the timing of when it enters the active staking pool is uncertain.
Ethereum also attracted fresh institutional attention through Tom Lee’s Bitmine, which added 50,928 ETH at an average price of $1,976, bringing the company’s total holdings to 4.47 million ETH, a position valued at roughly $9.9 billion. The scale of that accumulation, in the midst of a difficult macro environment, suggests a specific institutional conviction about Ethereum’s medium-term trajectory.
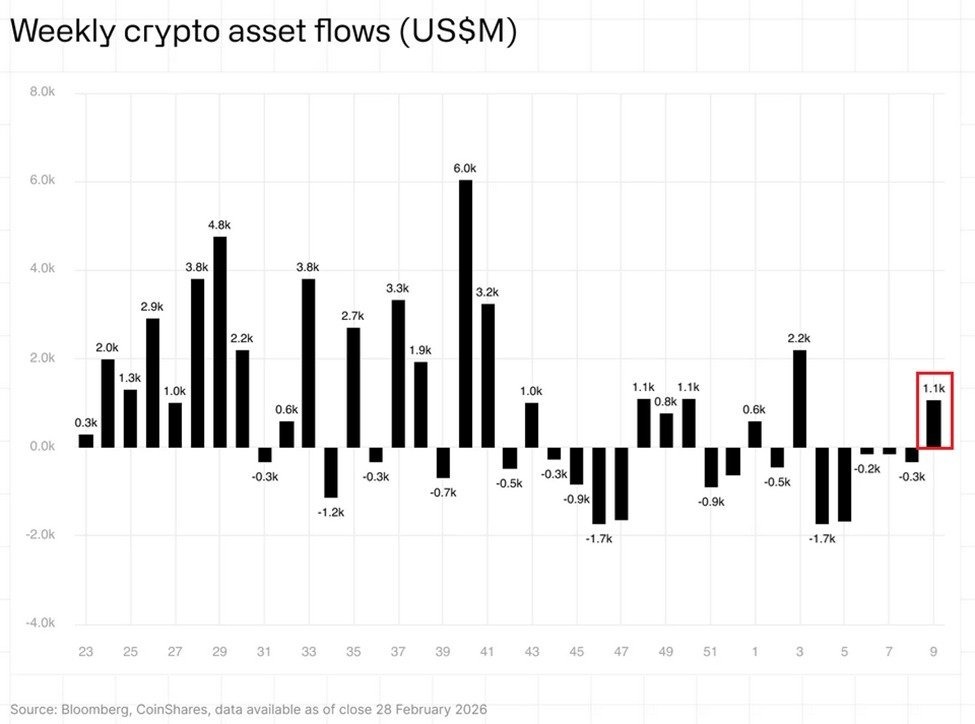
Crypto fund flows reflected the recovering institutional interest more broadly. After five straight weeks of net outflows totaling $4 billion, the asset class reversed to $1 billion in net inflows. Bitcoin led with $881 million, Ethereum added $117 million, and Solana extended its 2026 accumulation streak with a running total of $156 million in net inflows since January.
Altcoin Sentiment Near Historic Lows
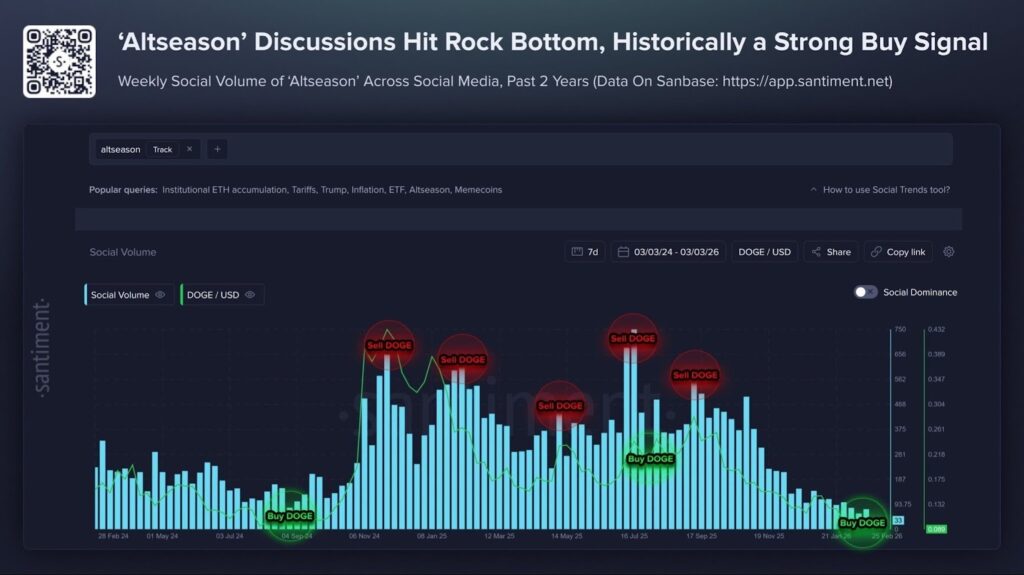
The broader altcoin market painted a bleaker picture. Search interest in “altseason” dropped to some of its lowest levels in years, with most alternative tokens trading near or at historical lows. Sentiment data from Santiment flagged the level of pessimism as one of those contrarian moments where the setup for a recovery can form, though this kind of reading requires patience and a catalyst. Without a clear macro improvement, sentiment data alone rarely produces sustainable reversals.
The Put-Call skew referenced above for S&P 500 options had a parallel in crypto derivatives. Options traders remained positioned heavily for downside, reflecting the kind of crowded bearish consensus that can, paradoxically, set up a short squeeze. But squeezes require a trigger, and with the war unresolved, energy costs elevated, and rates under pressure, the market needs something new to change the equation.
Institutional Moves and Regulatory Developments
Morgan Stanley Files for a Bitcoin ETF
Morgan Stanley submitted an S-1 filing for a Bitcoin Trust ETF, with BNY Mellon and Coinbase Custody named as custodians. The timing is notable, major institutions continue to expand their crypto infrastructure even as market prices remain well below their 2025 peaks. This reflects the longer-term thesis that regulatory clarity and Wall Street infrastructure are being built through the downturn, not despite it.
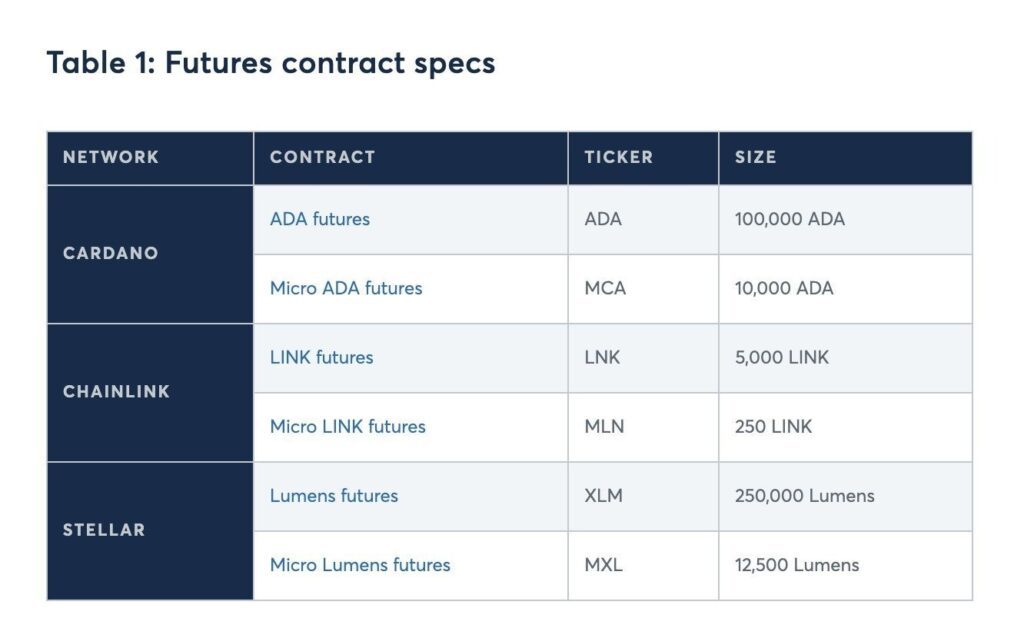
The CME Group expanded its crypto derivatives coverage, announcing that futures contracts on the platform now cover more than 75 percent of total crypto market cap. Cardano, Chainlink, and Stellar were added to the futures lineup, extending institutional-grade hedging tools to a wider range of tokens.
The SEC officially dropped its case against Tron founder Justin Sun, closing litigation that had involved allegations related to token offerings and market conduct. The resolution was consistent with the broader regulatory posture shift under the current administration.
On the legislative side, a Senate Banking Committee bill included a provision banning the Federal Reserve from issuing a retail-focused central bank digital currency (CBDC). The restriction was set with a 2030 expiration date, framing it as a temporary measure while broader policy debate continues.
Trump’s Crypto Agenda Moves Forward
US President Trump publicly warned that the crypto industry could “end up moving to China” if banks continued to obstruct the digital asset market structure bill currently in Congress. He added that his administration would not allow banks to block its crypto agenda. The messaging was designed to put pressure on financial institutions resistant to the regulatory framework and signaled continued White House political commitment to the industry.
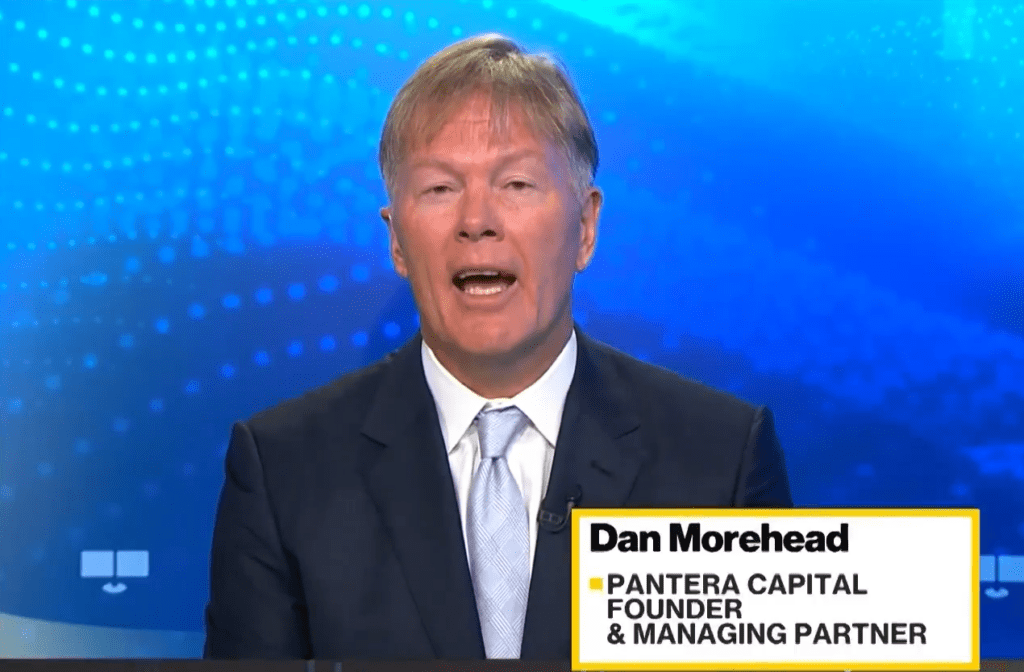
Pantera Capital’s Dan Morehead articulated the longer-term structural argument for crypto clearly this week: AI agents cannot open bank accounts or transact in cash. Crypto provides the financial infrastructure for AI systems to exchange value at scale. As AI adoption compounds, so, in theory, does demand for crypto rails. It is an argument that resonates more as a long-term thesis than as a short-term price catalyst, but it contributes to the institutional conviction visible in this week’s fund flows and corporate moves.
Western Union Enters Stablecoin Territory
Western Union announced a partnership with Crossmint to launch a dollar-denominated stablecoin called USDPT on the Solana network. The move brings one of the world’s most recognizable payment brands into on-chain settlement infrastructure, and it signals continued momentum toward institutional stablecoin adoption in cross-border payment corridors.
The Week in Summary
This was a week shaped by war first and markets second. Everything, oil, gold, bonds, equities, and crypto, moved in relation to what was happening in the Gulf. The Strait of Hormuz remains the single most important variable to watch going forward. If it reopens through diplomatic pressure or military developments, energy prices can normalize, inflation expectations can stabilize, and the macro lid on risk assets eases. If the disruption persists, the pressure continues.
Bitcoin’s bounce from $63,000 to $74,000 was genuine and structurally meaningful, it showed that demand exists, that ETF flows can turn quickly, and that short positions can be squeezed. But the failure to hold above $73,000–$74,000 also showed that the market is not yet in a regime of sustained buyers. The correlation with equities remains high, and the macro environment tied to the war has not resolved.
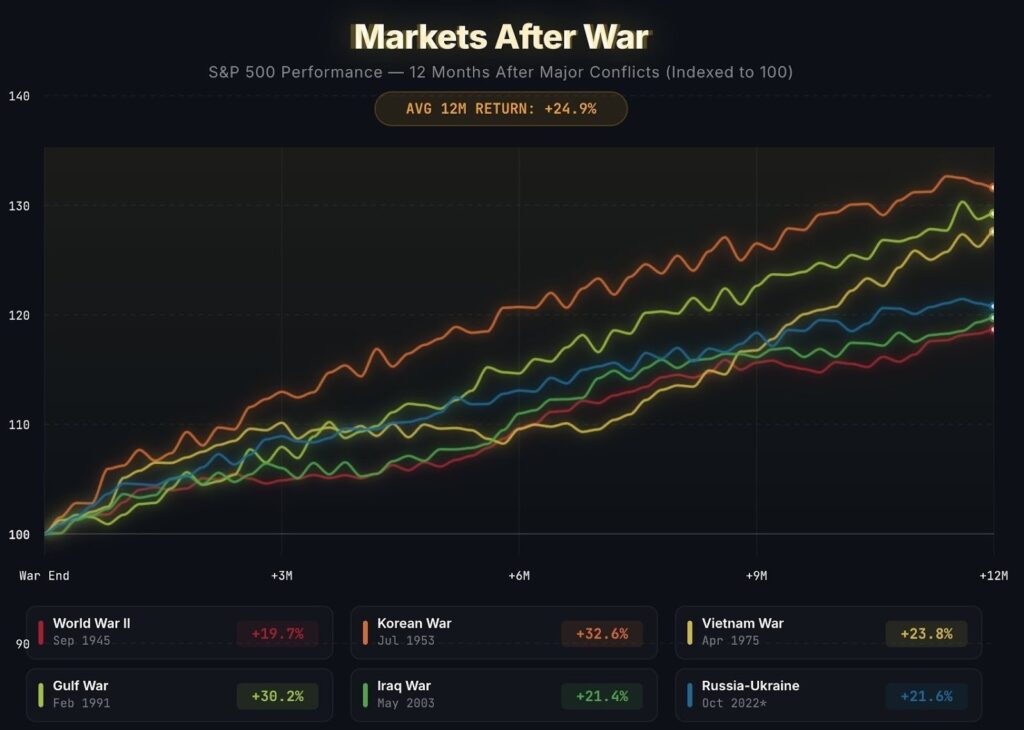
History offers one modest point of perspective. The average 12-month return for the S&P 500 following any major war is roughly 24.9 percent. Markets often price in the worst and then recover harder than the headlines suggest. That does not mean a recovery is imminent, or that it cannot get worse first. But it is worth remembering that volatility is not the same as permanent loss.
The next week hinges on whether the $70,000 level holds for Bitcoin, whether diplomatic signals from Iran gain credibility, and whether energy costs begin to stabilize. The war is not over. The market knows that. Every price in the chart this week reflected it.
This article is not financial advice. Please do your own research before making any investment decisions. You can also explore more crypto insights on blog.millionero.com. When you’re ready, you can trade spot and perpetuals on Millionero.