
After two days of facing a price retest at $60,000, the Bitcoin key support areas have emerged again above $62,0000, while its trend line has formed an upward 24-hour graph.
An upward trend line has formed in Bitcoin price charts over a 24-hour period, hinting at a reversal of crypto price trends. As a result, the Bitcoin key support levels have formed at $62,000. This could have occurred since Bitcoin passed its price retest around $60,000 but did not decline below the mark. Other altcoins are also on the brink of a rally with the improving crypto price trends.
However, volatility in the crypto market could be set to increase, as $1.35 billion in Bitcoin options expires this week. Last week, bulls could not hold BTC above $65,000 at a similar juncture. Although this week could turn out differently, traders are still cautious about the impact of the expiration of options.
A leading market intelligence firm posted findings that showed how whales have started accumulating BTC again. It noted a tight range for Bitcoin between $61,000 and $64,000 and said that wallets with 1K-10K BTC have recently collected $941 million worth of tokens. As a result, it claimed that their holding levels have surged to the highest in two weeks.
The other focus altcoin was Solana in the last 24 hours. It crossed $150 again with a market cap of over $2.2 billion.
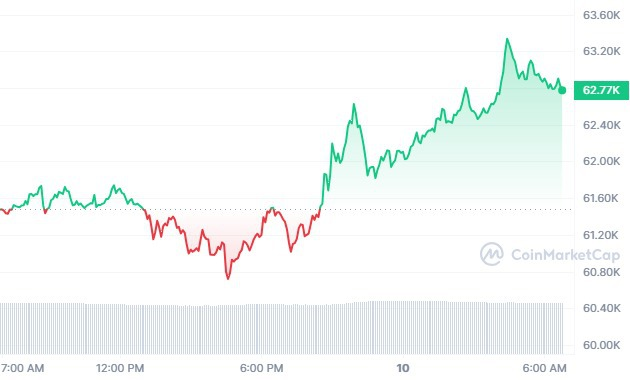
BTC/USD 1D price chart
Bitcoin is currently trading at around $62,900 on May 10, 2024, with BTC/USD trading higher by a margin of 2.26% in the last 24 hours. Bitcoin’s market cap was trading at around $ 1.23 trillion in the last 24 hours.
BTC/USD is trading above its 20-day EMA (62,793.82), as BTC’s 24-hour volume was at around $25.4 billion. The global crypto market cap increased by around 2.07%, trading above $2.32 trillion. BTC’s year-to-date returns are at 50.04%.
Join Millionero and enter the crypto market seamlessly as a trader and investor!