
While the global crypto market cap stayed under $2.5 trillion, traders observed volatility in the Bitcoin price direction, with the token trading above $60,000.
The crypto market has displayed sudden phases of volatility in the last 24 hours. After trading just above $62,000 for some time, it shot up above $64,000 on April 30. After a few hours, it again dipped below $62,000, likely due to selling pressures. Hence, traders saw the Bitcoin price direction change paths multiple times, which created uncertainty in the crypto market. Although Bitcoin saw a dip of around 13% this month, its year-to-date returns have been firm.
A bunch of reasons, starting from outflows in the spot Bitcoin ETFs, to lower activity among crypto bulls could have caused it. They have battled with bears for the $63,000 support for Bitcoin in the past one week.
Despite the increasing outflows from the US ETFs, a positive development has emerged in Asia. A few spot crypto ETFs have started trading in Hong Kong, creating a new opportunity for crypto investors there.
Once these ETFs gather more inflows, they could become an added support for the crypto market with the US ETFs. The first day of trading witnessed around $11 million in volume for the Hong Kong ETFs.
Bitcoin’s volatility also affected other altcoins, which traded with subdued returns in the last few days.
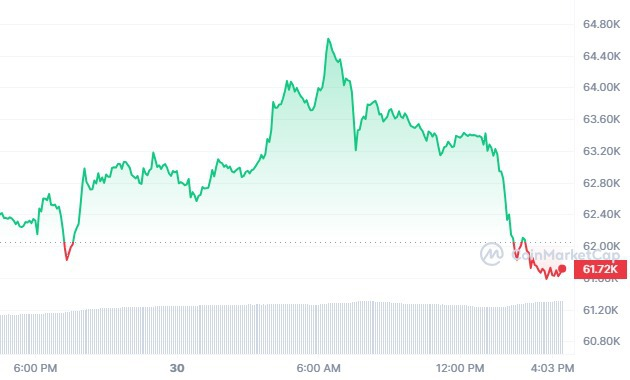
BTC/USD 1D price chart
Bitcoin is currently trading at around $61,700 on April 30, 2024, with BTC/USD trading lower by a margin of 1.18% in the last 24 hours. Bitcoin’s market cap was trading at around $ 1.21 trillion in the last 24 hours.
BTC/USD is trading below its 20-day EMA (65,820.26), as BTC’s 24-hour volume was at around $28 billion. The global crypto market cap decreased by around 1.88%, trading above $2.27 trillion. BTC’s year-to-date returns are at 47.21%.
Join Millionero and start trading crypto today!