
The Bitcoin price index has been relatively at the same level since July 10, while the crypto market cap also managed to do the same and hovered above $2 trillion.
The Bitcoin price index has presented a recovering price graph after a minor dip on July 10. Rising from $57,000, Bitcoin has remained fairly stable compared to the sell-offs of the previous week. At the same time, the crypto market cap has also held its support, trading above $2 trillion.
The recent price recovery suggests that Bitcoin may have found temporary support around the psychologically significant $60,000 mark. This level previously held strong in February and May, acting as a floor for the price. However, it needs to consolidate above this level to initiate a rally to $70,000. Spot buying levels have increased significantly, which contributed to the rally.
Meanwhile, a dose of optimism has also emerged in the market after bears slowed down the pace of sell-offs. The broader economic climate has also stayed at the same levels, which may have led to stability. The absence of a big catalyst has led to lower levels of crypto volatility in the last few days. The same scenario was also evident among other tokens, which were also trading at the same trading ranges.
However, ETH rose by around 1% and could soon touch $3,200.
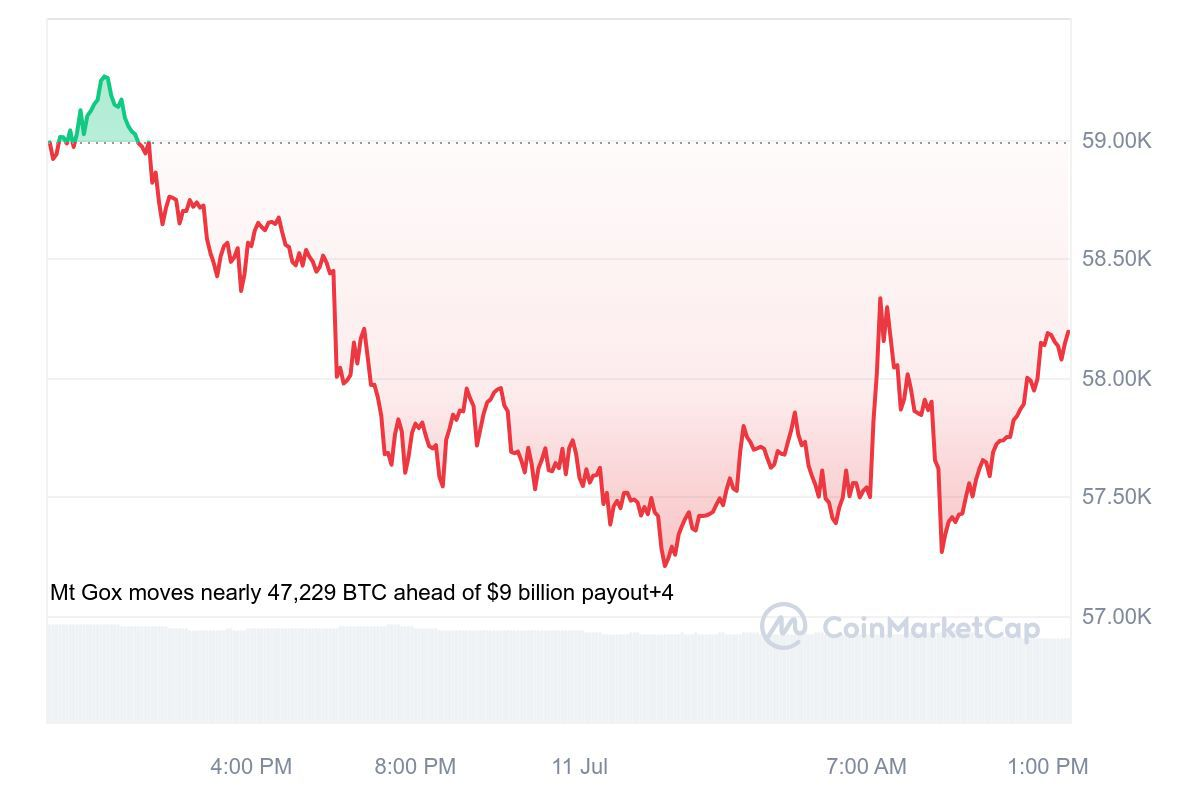
BTC/USD 1D price chart
Bitcoin is currently trading at around $58,100 on July 11, 2024, with BTC/USD trading lower by a margin of 1.03% in the last 24 hours. Bitcoin’s market cap was trading at around $1.14 trillion in the last 24 hours.
BTC/USD is trading lower than its 20-day EMA (61,192.78), as BTC’s 24-hour volume was at around $24.8 billion. The global crypto market cap decreased by around 0.64%, trading above $2.14 trillion. BTC’s year-to-date returns are at 38.78%.
Join Millionero to start a journey in the crypto market with trading and investing!