
The upward run in the crypto market has continued, with Bitcoin price indicators leading the signals for buying across the market, while bearish signs have almost disappeared.
The crypto market has continued its stable run post the BTC halving event. While bearish signals are negligible, bulls have also been slightly defensive. Bitcoin price indicators have reflected these signs. Although they’re still in the green, Bitcoin prices have been static. The $66,000 level has acted as Bitcoin’s support over the last couple of days.
On the other hand, the crypto support zone in the market is relatively balanced. Volatility has decreased, and the crypto support levels for multiple tokens are robust. In the last few days, the crypto market’s gain signaled the potential for further climbs. For the short term, buyers need to hold BTC’s price above its 50-day moving average to maintain the bullish spirit.
Analysts also noted reduced selling pressure and balanced market sentiments in crypto. Joe Burnett, a popular BTC proponent, reinforced his belief in crypto.
He said, “Bitcoin is the one asset with the most superior monetary properties and does not melt, no matter how much wealth is stored in Bitcoin.”
An altcoins recovery is also going on in the crypto market. ETH, for instance, has rallied over 6% in the last seven days. XRP and SOL have also experienced double digit weekly returns.
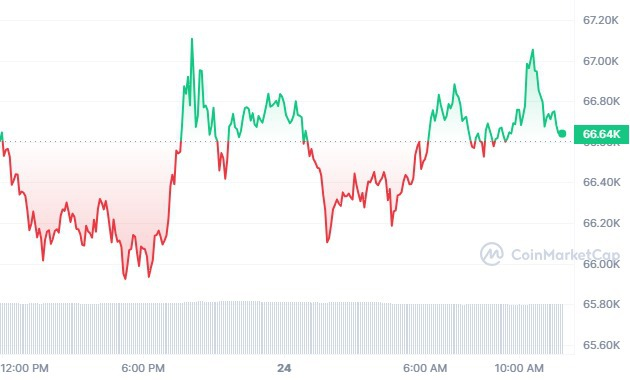
BTC/USD 1D price chart
Bitcoin is currently trading at around $66,600 on April 24, 2024, with BTC/USD trading higher by a margin of 0.42% in the last 24 hours. Bitcoin’s market cap was trading at around $ 1.31 trillion in the last 24 hours.
BTC/USD is trading below its 20-day EMA (67,011.17), as BTC’s 24-hour volume was at around $24 billion. The global crypto market cap increased by around 0.85%, trading above $2.46 trillion. BTC’s year-to-date returns are at 59.16%
Join Millionero and start trading and investing in the crypto bull market!