
The latest decline in the crypto market was followed by a minor recovery, while the current Bitcoin trading metrics indicate a static run for its price graph in the short term.
In the last 24 hours, Bitcoin and its price graph have represented a parabolic direction. It dipped to $56,000 and then again went through a slight recovery to $58,000. The price battle between bulls and bears is evident from the graph. As a result, the current Bitcoin trading metrics are broadly neutral. It could result in static movements for BTC in the days ahead.
Booming equity markets worldwide may have led to some reallocation in investor holdings. A few big investors could have also booked profits in the crypto market. Although the exact reason is unclear, crypto indicators point to stable yet neutral sentiments in the market. The present crypto indicators might only turn bullish once BTC crosses $60,000.
Crypto data analysis platforms have also highlighted the surge in open interest on Bitcoin futures. Both long and short positions on Bitcoins are thus rising. Hence, the price direction of Bitcoin can move either way in the next few days, and is uncertain at the moment.
Meanwhile, bulls need to gather strength for BTC’s price around its 20-day moving average. Surpassing that level could ignite optimistic signals in BTC’s price graph. Daily trading volumes in the market are also comparatively stable now.
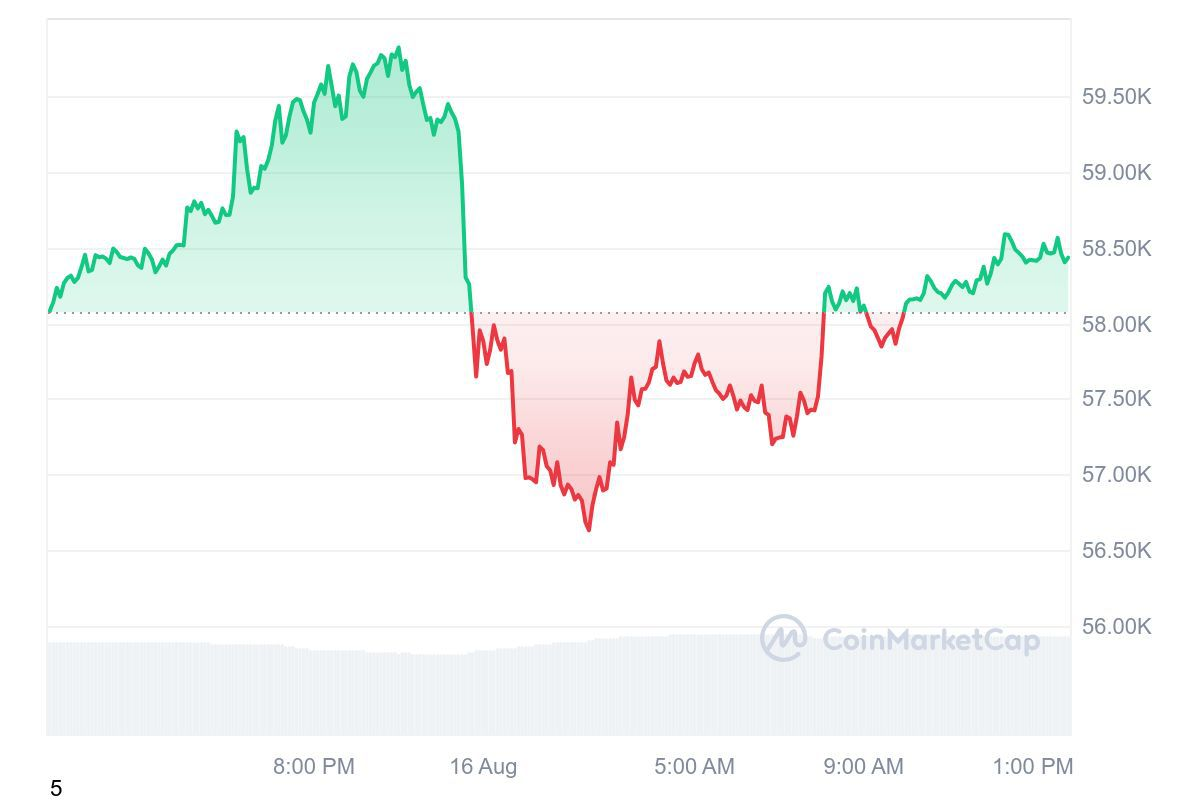
BTC/USD 1D price chart
Bitcoin is currently trading at around $58,200 on August 16, 2024, with BTC/USD trading lower by a margin of around 0.2% in the last 24 hours. Bitcoin’s market cap was trading at around $1.1 trillion in the last 24 hours.
BTC/USD is trading below its 20-day EMA (around 62,000), as BTC’s 24-hour volume was at approximately $34 billion. The global crypto market cap increased by around 0.5%, trading above $2 trillion. BTC’s year-to-date returns are above 39%.
Join Millionero and start trading crypto on our platform today!