
A snap sell-off at the end of the week sent the BTC price graph downward, but the $69,000 support zone helped Bitcoin’s price stabilize around it.
Since last week, Bitcoin has been attempting to break ahead of its resistance level at $72,000. But the flash dip on June 7 might have altered this trajectory. Experts have claimed that the recent US jobs data could have led to the decline of the BTC price graph last week. Since the jobs scenario has shown improving numbers, the Federal Reserve could postpone its rate cuts further.
Meanwhile, the first week of June 2024 witnessed a significant surge in Bitcoin’s price. It broke a holding pattern and reached its highest level since early April. However, this upward movement could be followed by a period of consolidation. Bitcoin’s price may hover around a fixed range between $69,000 and $72,000 in the next few days.
Several key factors contributed to Bitcoin’s price increase last week. One major driver was the positive sentiment surrounding the potential approval of a spot Ethereum ETF in the US. This anticipation mirrored the excitement surrounding the launch of US Bitcoin ETFs in mid-January, which coincided with a previous surge in Bitcoin’s value.
Once these ether ETFs take off this month, the crypto market could see a new surge in volatility for the better. Moreover, ether’s price has already consolidated above $3,700.
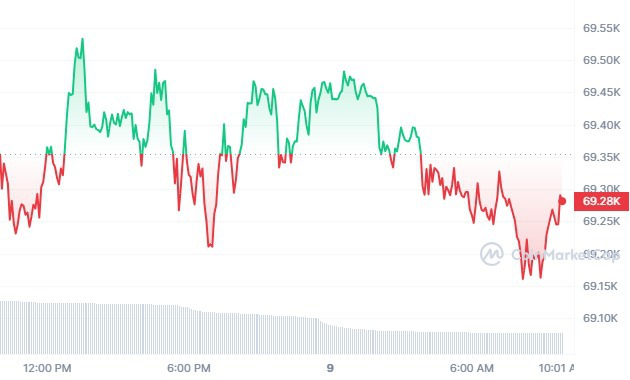
BTC/USD 1D price chart
Bitcoin is currently trading at around $69,200 on June 9, 2024, with BTC/USD trading higher by a margin of 2.22% in the last 24 hours. Bitcoin’s market cap was trading at around $ 1.37 trillion in the last 24 hours.
BTC/USD is trading higher than its 20-day EMA (68,010.01), as BTC’s 24-hour volume was at around $13.5 billion. The global crypto market cap decreased by around 0.71%, trading above $2.35 trillion. BTC’s year-to-date returns are at 64.93%
Join Millionero to start trading crypto seamlessly!