
Although Bitcoin’s trading range experienced high volatility in the last 24 hours, the overall crypto price graph, with firm fundamentals, did not see its stability decrease.
A detailed price analysis of Bitcoin’s trading range reveals robust indicators. Bears have consistently tried to pull it below its support in the last few days but haven’t succeeded. In contrast, Bitcoin is trading securely above $64,000 with support from bulls. On the other hand, the crypto price graph has also seen stable movements over the last few days. The trend might continue until the market sees its next trigger from the Bitcoin halving event.
Buyers could aim to push BTC’s price above $69,000 on a consolidated level. Once it crosses the level again, the next phase of Bitcoin’s uptrend could start. Meanwhile, bears would have to push BTC’s price below its 20-day moving average to gain strength, but it looks unlikely. Moreover, BTC’s increasing price support in its current trading range indicates a rally.
Ethereum was the clear winner of the last 24 hours, crossing $3,800 and setting a new all-time high. The momentum in ETH could continue for a long run, which is an extremely bullish signal. Resistance for ETH has formed at around $3,900, while its market cap is trading at over $450 billion.
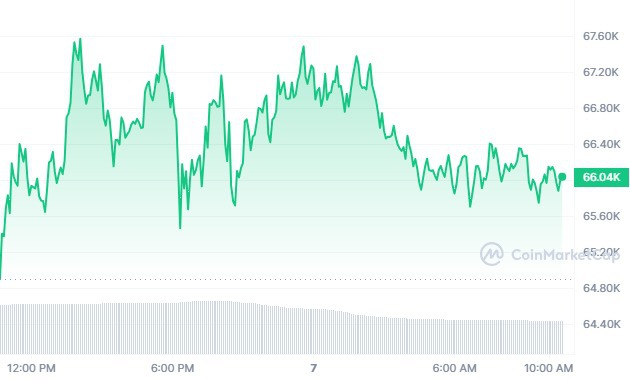
BTC/USD 1D price chart
Bitcoin is currently trading at around $ 66,000 on March 7, 2024, with BTC/USD trading lower by a margin of 0.2% in the last 24 hours. Bitcoin’s market cap was trading at around $ 1.3 trillion.
BTC/USD is trading higher than its 20-day EMA (55,979.78), as BTC’s 24-hour volume was at around $63 billion. The global crypto market cap increased by around 0.7%, trading above $2.48 trillion. BTC’s year-to-date returns are at 57%.
Join Millionero, which presents several user-friendly features for the best crypto trading experience!