
Traders saw the crypto volatility chart witnessing wide movements as the overall market went through sudden jumps in volatility, while BTC traded just above $41,000.
Bitcoin’s volatility has increased in the last 24 hours, while the overall crypto market cap has decreased. On January 18, BTC went through a phase of selling activity, after which its price went close to $40,500. Bulls eventually came to its rescue and helped it recover until it was above $41,000. As a result, the crypto volatility chart saw its metrics going higher.
The reason for the week-long bearish activity in the market could be uncertain. Although institutional buying has increased after the spot Bitcoin ETFs, it hasn’t spilled over to the crypto market. Analysts believe the narrow trading range could continue for some more time until a macroeconomic trigger. A few traders also highlighted more liquidity around BTC’s spot price, which prevents bulls from taking it higher.
The US Dollar Index has also strengthened relatively, which could have led to more selling pressure on the crypto market. At the same time, panic sell-offs in the crypto market in the last few days cannot be ruled out as well. BTC may have to hold $40,000 over the weekend to prevent a price decline next week.
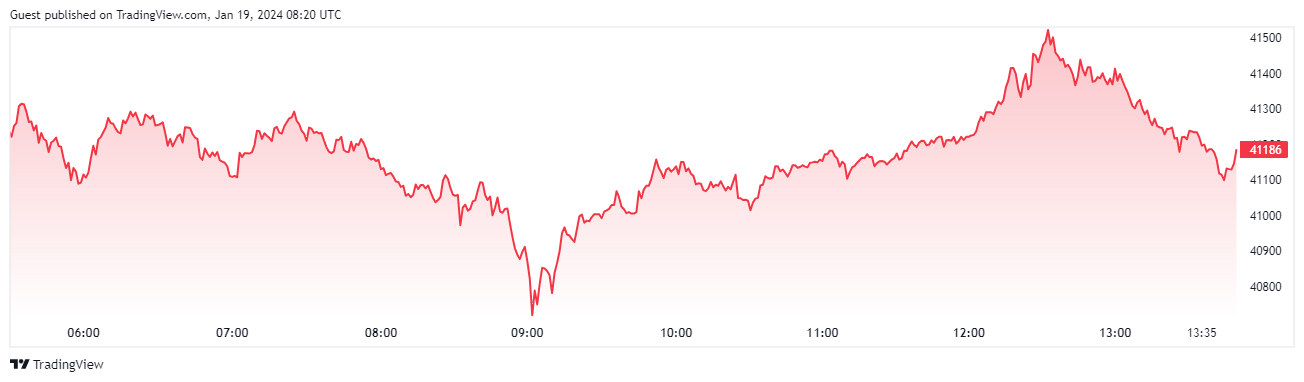
BTC/USD 1D price chart
Bitcoin is currently trading at around $41,100 on January 19, 2024, with BTC/USD trading lower by a margin of 4% in the last 24 hours. Bitcoin’s market cap was trading at around $806 billion.
BTC/USD is trading lower than its 20-day EMA (43,655.25), as BTC’s 24-hour volume was at around $27 billion. The crypto market cap decreased by around 3.3%, trading above $1.63 trillion. BTC’s year-to-date returns are at -1.71%.
With Millionero, you can start crypto trading instantly, helped by a long list of our features that are useful for both beginners and advanced traders!