
Even with an uncertain price graph of multiple crypto tokens, the spot Bitcoin ETF metrics have been bullish over the past many days, while inflows were the leading positive indicator.
Bitcoin has been trading in a fixed trading range over the weekend, which hovers just above $58,000. At the same time, volatility in other crypto tokens has been elevated for some time. The factor inducing stability at this juncture might be the spot Bitcoin ETF metrics. The ETFs have attracted sufficient inflows over the last week to provide the necessary price support to Bitcoin.
Meanwhile, these metrics might be a dominant factor in influencing the Bitcoin price trends for the rest of this year. Official data indicates that the month of August has been broadly neutral for the ETF inflows. Yet, the net flows remain in the green, which is a good sign. A couple of ETFs, like Fidelity and BlackRock, have been the best performers.
Moreover, Bitcoin price trends of this week could also depend on how it tackles its resistance at $60,000. While it has sustained its dominance in the market, its price levels have faced both bullish and bearish pressures. On the upside, its support has been firm at $56,000. The next major catalyst for the market could emerge when BTC crosses its 20-day moving average.
BTC/USD 1D price chart
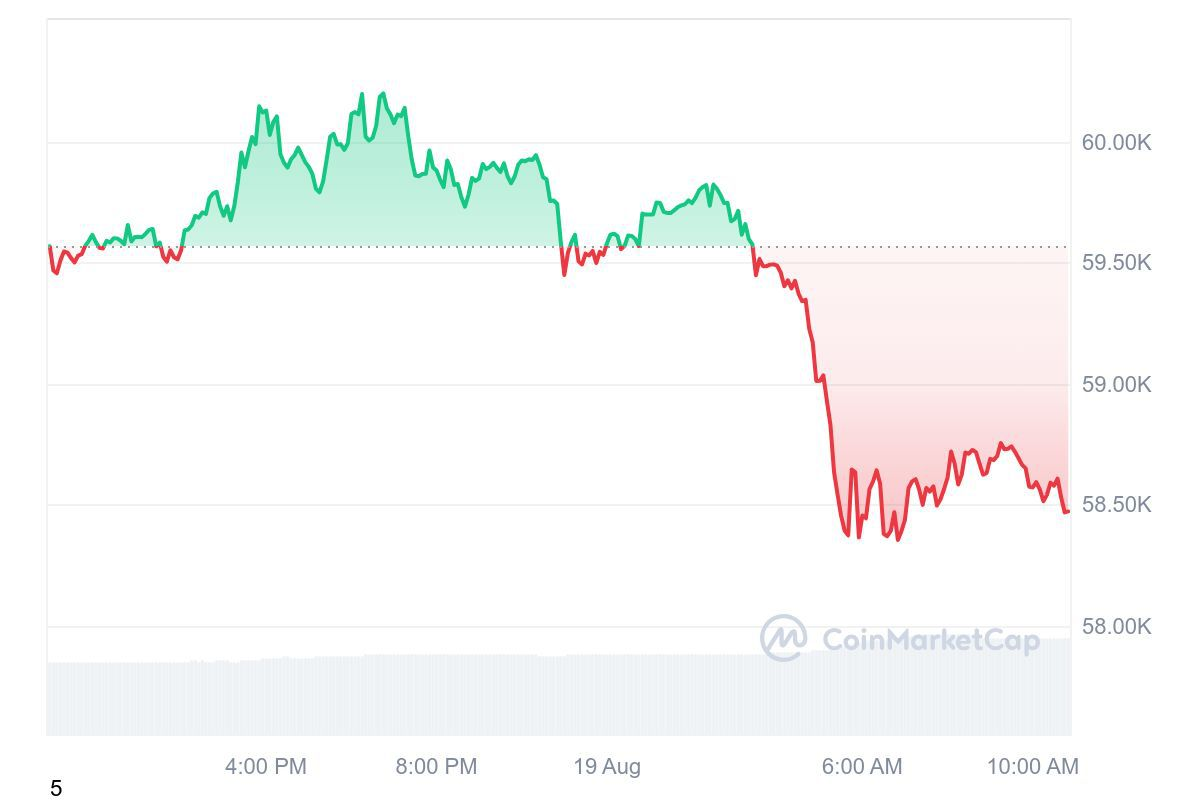
Bitcoin is currently trading at around $58,400 on August 19, 2024, with BTC/USD trading lower by a margin of around 1% in the last 24 hours. Bitcoin’s market cap was trading at around $1.1 trillion in the last 24 hours.
BTC/USD is trading below its 20-day EMA (around 61,400), as BTC’s 24-hour volume was at approximately $19 billion. The global crypto market cap decreased by around 0.7%, trading above $2 trillion. BTC’s year-to-date returns are above 39%.
Interested in trading and investing in crypto? Join Millionero today!