If you have spent any time looking at a price chart, you have probably noticed a wavy line sitting in a separate panel beneath the candles, drifting between two horizontal lines. That line is very often the Relative Strength Index, better known as RSI. It is one of the most widely used tools in a trader’s kit, and also one of the most frequently misunderstood. This guide walks through what RSI actually measures, how to read it, and how to put it to work in the fast-moving world of crypto trading on Millionero.
What Is the RSI Indicator?
The Relative Strength Index is a momentum oscillator. Rather than telling you where price is, it tells you how quickly and how forcefully price has been moving. It does this by comparing the size of recent gains to the size of recent losses, then expressing the result as a single number that swings between 0 and 100. When buyers have been dominant, the reading rises toward the top of that range. When sellers have taken control, it falls toward the bottom.
Because it lives between fixed boundaries, RSI is what analysts call a bounded oscillator. That fixed range is part of what makes it so useful. No matter whether you are looking at a coin trading at fractions of a cent or one priced in the tens of thousands, the indicator speaks the same language. A reading of 70 means the same thing structurally on any asset, which makes RSI easy to compare across markets.
A Brief History
RSI was developed by J. Welles Wilder Jr., an American mechanical engineer turned technical analyst, and introduced to the world in his 1978 book New Concepts in Technical Trading Systems. The same book gave traders several other staples, but RSI has arguably had the longest shelf life. More than four decades later, it remains a default indicator on virtually every charting platform, and its core logic has survived the move from stocks and commodities to the around-the-clock crypto markets largely intact.
How RSI Is Calculated
You will almost never need to compute RSI by hand, but understanding the math demystifies the readings. The indicator is built on a simple relationship between average gains and average losses over a chosen number of periods. In plain terms, the formula takes the relative strength of a market, which is its average gain divided by its average loss across the lookback window, and converts that into a value between 0 and 100.
The default window is 14 periods, which means 14 candles of whatever timeframe you are watching. That is 14 hours on an hourly chart, 14 days on a daily chart, and so on.
The intuition is straightforward. When average gains heavily outweigh average losses, relative strength becomes large and the reading climbs close to 100. When losses dominate, it shrinks and the reading sinks. A market with perfectly balanced gains and losses would sit right around 50, the neutral midpoint.
Reading the RSI: What the Numbers Mean
The real skill is not calculating RSI but interpreting it, and that starts with knowing the zones that matter.
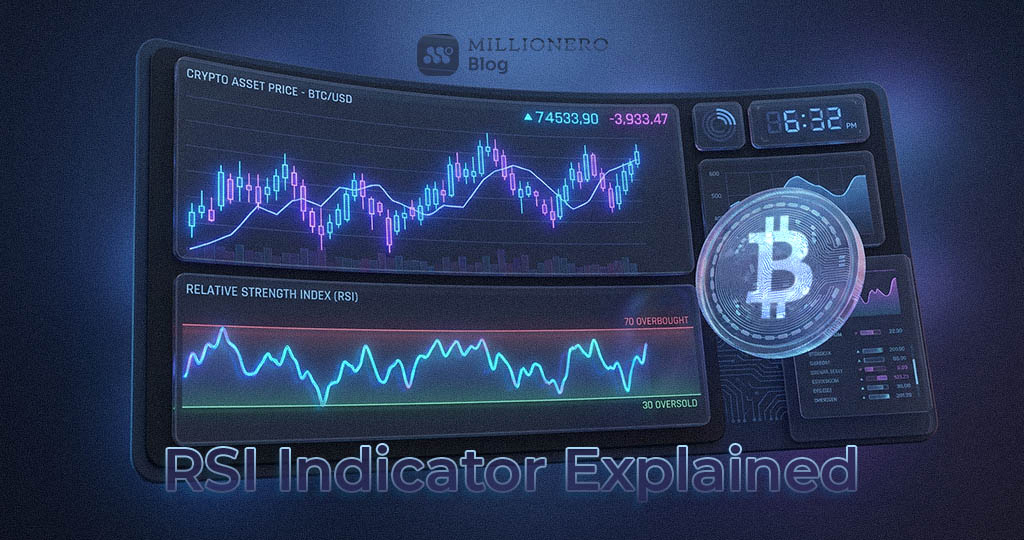
Show Image RSI sits in its own panel beneath the price, translating recent momentum into a single line between 0 and 100.
Overbought and Oversold Zones
The two horizontal lines you see on most RSI panels are drawn at 70 and 30. A reading above 70 is traditionally labeled overbought, suggesting price has rallied quickly and may be due for a pause or pullback. A reading below 30 is oversold, hinting that selling has been aggressive enough that a bounce could be near.
It is worth being precise about language here, because this is where most beginners go wrong. Overbought does not mean sell now, and oversold does not mean buy now. These are conditions, not signals. A strong asset can remain overbought for a long time while it continues climbing, and a coin in freefall can stay oversold for days. The zones tell you that momentum is stretched. What you do with that information depends on the wider context.
The Centerline and Momentum Shifts
The level that often gets overlooked is the 50 line running through the middle. Because 50 marks the balance point between average gains and losses, it works as a rough dividing line between bullish and bearish momentum. When RSI holds above 50, buyers generally have the upper hand. When it spends most of its time below 50, sellers are in control. Many traders use a crossover of the centerline as an early read on whether momentum is shifting, well before price makes it obvious.
How to Use RSI in Crypto Trading
With the zones understood, the indicator becomes a practical decision-support tool. There are three main ways traders apply it, and each suits a different market situation.
Spotting Overbought and Oversold Reversals
The most basic application is watching for RSI to push into an extreme and then turn back. A reading that climbs above 70 and then crosses back below it is often treated as an early warning that an uptrend is losing steam. The mirror image, a dip below 30 followed by a cross back above it, can flag a potential bottom. The key word is confirmation. The reversal back across the threshold matters more than simply reaching it, because it shows momentum has actually started to fade rather than merely stretching further.
Trading RSI Divergence
Among RSI’s most respected uses is the detection of divergence, which occurs when the indicator and price disagree. In a bearish divergence, price grinds out a higher high while RSI prints a lower high. That is a sign the new peak was reached with less underlying momentum, often a precursor to weakness. A bullish divergence is the reverse. Price carves a lower low, but RSI makes a higher low, hinting that selling pressure is quietly exhausting itself.
Divergence is powerful precisely because it looks beneath the surface of price. Two rallies can look identical on the candles, but if the second was driven by weaker momentum, RSI exposes that gap. In crypto, where sharp reversals are common, learning to spot divergence early can be the difference between riding a move and getting caught at its peak.
Show Image A textbook bearish divergence: the second price peak is higher, yet RSI peaks lower, hinting the advance is running out of fuel.
RSI in Trending Versus Ranging Markets
A subtlety that separates experienced traders from beginners is recognizing that RSI behaves differently depending on the market regime. In a ranging, sideways market, the classic bounces off 70 and 30 tend to work well, because price keeps oscillating between support and resistance and RSI mirrors that rhythm. In a strong trend, however, those signals can mislead you badly.
During a powerful uptrend, RSI often spends extended stretches above 50 and repeatedly tags overbought without any meaningful pullback. Selling every time it crosses 70 would have you fighting the trend and exiting far too early. In these conditions, many traders flip their approach and treat the band between 40 and 50 as support, looking to buy dips into that zone rather than fading every overbought reading. The first job, then, is always to identify whether you are in a trend or a range, because the same RSI reading carries opposite meaning in each.
Show Image In a sustained uptrend, RSI repeatedly tags overbought while the 40 to 50 band quietly acts as support on pullbacks.
Adjusting RSI for Crypto Volatility
The default setup of 14 periods with lines at 70 and 30 was designed for the slower, regulated markets of the late 1970s. Crypto moves faster and swings harder, which is why many traders adapt the settings to suit it.
Two adjustments are common. The first is widening the thresholds to 80 and 20, which filters out the constant noise of minor swings and only flags the more genuine extremes. That is a sensible change in an asset class where 70 gets touched routinely. The second is shortening or lengthening the period. A shorter lookback, such as 7, makes RSI more sensitive and responsive for active short-term trading, while a longer one, such as 21, smooths the line for those focused on the bigger picture. There is no single correct configuration. The right choice depends on your timeframe, your strategy, and the particular coin you are trading.
Common Mistakes and Limitations
For all its usefulness, RSI is not a crystal ball, and treating it as one is the fastest route to losses. Its greatest weakness is the one already mentioned. In a sustained trend it can remain pinned in an extreme zone far longer than seems reasonable, generating a stream of false reversal signals for anyone trying to call the top or bottom on RSI alone.
It is also a lagging indicator to a degree, since it is built entirely from past price data. RSI describes momentum that has already happened. It cannot foresee a sudden news event, an exchange listing, or a liquidation cascade. And like any single indicator, it produces its share of whipsaws, the quick and contradictory signals in choppy conditions that shake out traders who act on every flicker. The lesson is consistent across all of these. RSI is one input among many, never a standalone trading system.
Combining RSI With Other Tools
Because no indicator works well in isolation, RSI shows its true value when paired with confirming evidence. A favorite combination is RSI with moving averages, using the trend direction from a moving average to decide whether to trust an overbought or oversold signal. You might take oversold bounces only when the broader trend is up, for instance. Others layer RSI over support and resistance levels, treating a bullish divergence at a major support zone as a far stronger setup than the same divergence floating in open space.
Volume is another natural partner, since a reversal flagged by RSI carries more weight when trading activity confirms a genuine shift in participation. The underlying principle is confluence. The more independent pieces of evidence that point the same direction, the higher the probability that the signal is real.
Final Thoughts
The Relative Strength Index endures for a reason. It distills something genuinely hard to see, the speed and conviction behind a price move, into a single readable number, and it does so on any asset and any timeframe. Used carelessly, as a simple rule to buy when oversold and sell when overbought, it will frustrate you. Used thoughtfully, with attention to market regime, an eye for divergence, settings tuned to crypto’s volatility, and confirmation from other tools, it becomes a sharp lens for reading momentum.
As with every technical tool, the path to using RSI well runs through practice. Pull it up on the charts inside your Millionero exchange account, watch how it behaves across different coins and conditions, and let it sharpen your sense of when momentum is building and when it is quietly running out.
This article is for educational purposes only and does not constitute financial advice. Cryptocurrency trading carries significant risk. Always do your own research and never invest more than you can afford to lose. Read more blog at Millionero Blog.