Markets often look like pure noise, but Elliott Wave Theory argues that beneath the chaos, price moves in repeating patterns that reflect the swinging mood of the crowd. Once you learn to read those patterns, you can anticipate where the market is likely to head next. This guide breaks the theory down, covers the rules that keep your wave counts honest, and shows how to turn the structure into actual trades.
What Is Elliott Wave Theory?
Elliott Wave Theory is a method for forecasting market direction based on the formation of certain repeating patterns. Developed in the 1930s by Ralph Nelson Elliott, it rests on a simple idea. Price advances and retreats in waves, and those waves come in two flavors.
Motive waves represent the current direction of the market. They are the impulsive, trending moves that carry price from one level to another. Corrective waves are the pullbacks against that trend, where the market pauses and catches its breath before the next push. If you remember nothing else, remember this. Motive waves are the trend, and corrective waves are the rest stops along the way.
The Basic Wave Structure
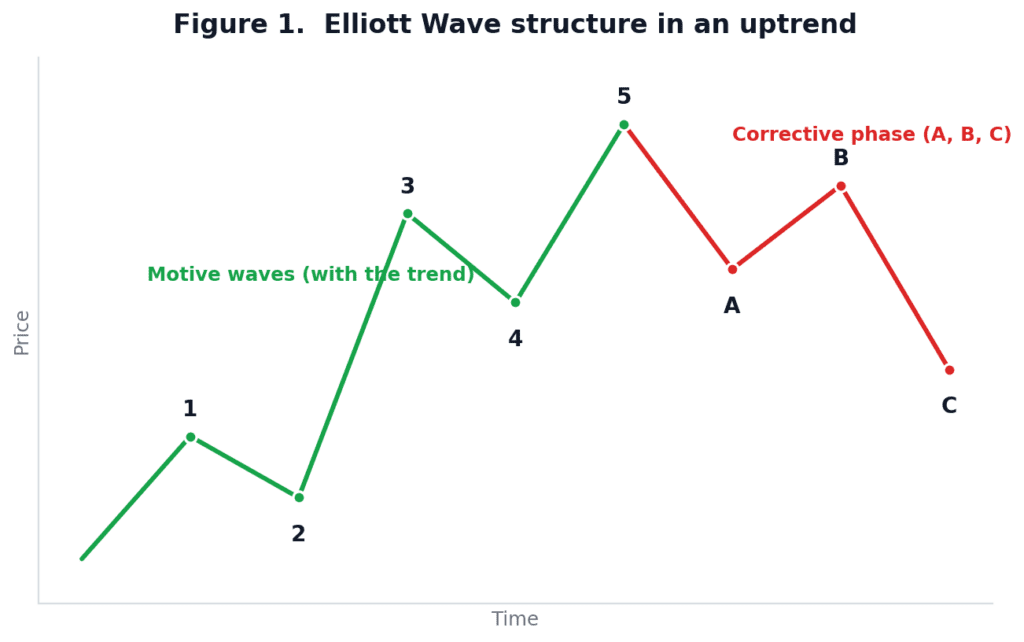
A complete cycle is made up of eight waves. The first five carry the market in the direction of the trend and are numbered one through five. The next three correct it and are labeled A, B, and C. Within the first five, waves one, three, and five move with the trend, while waves two and four are the smaller pullbacks tucked between them. After wave five completes, the trend shifts and the A, B, and C correction unfolds in the opposite direction.
When the market is in a bull trend, the motive waves are the upward moves and the corrective waves are the downward pullbacks against them.
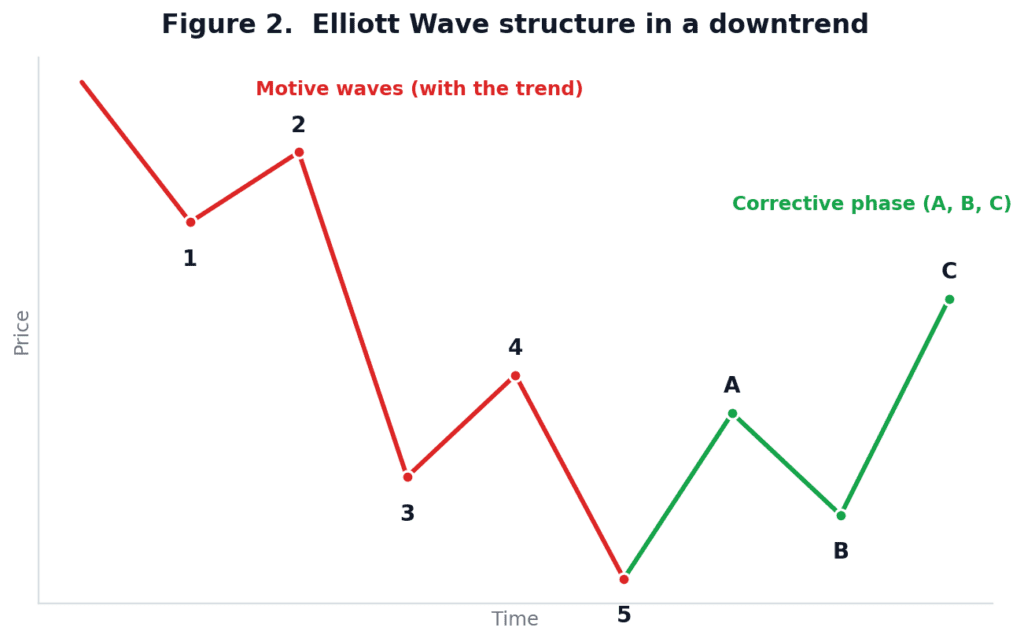
The same logic runs in reverse during a bear trend, where the motive waves are the downward moves and the corrective waves are the upward bounces. Once you can count waves in one direction, you already know how to count them in the other.
Supply, Demand, and Why Wave Three Is the Star
The third wave is usually the biggest and most profitable wave, and there is a clear reason why. Many traders place their stop loss orders near the swing high of wave one in an uptrend, or near the swing low of wave one in a downtrend. When wave three breaks through that level, all of those stops trigger at once, pouring extra fuel onto the move and making wave three the longest and most aggressive leg of the sequence.
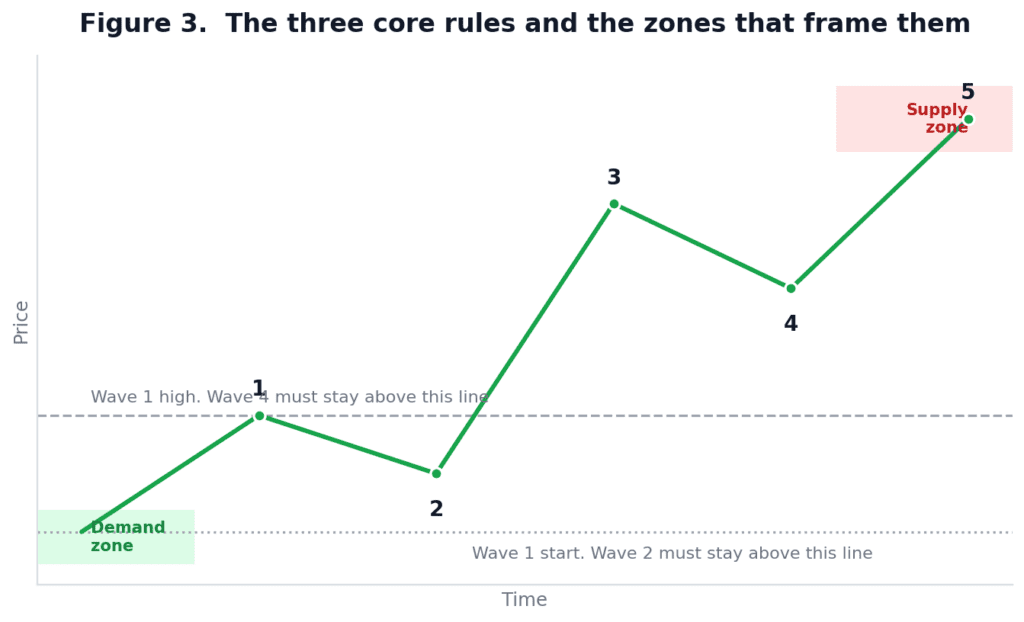
The story begins inside a demand zone, where buyers quietly absorb supply. When that accumulation is done, wave one launches the trend, and wave two corrects part of it without retracing the full distance of wave one. At the other end, wave five carries price into a supply zone in an uptrend, which is typically where the advance reverses. In a downtrend, the bottom of wave five marks the supply zone in mirror image. It is also worth noting that wave C and wave three behave alike. Both are impulsive and show the same aggression.
The Rules That Keep Your Count Honest
Elliott Wave Theory gives you a lot of freedom, which is exactly why traders get into trouble with it. A few rules must always hold, and if a count breaks one of them, the count is wrong and needs to be redrawn.
Rule one. Wave two can never retrace more than 100 percent of wave one. If price falls back below where wave one started, your count is invalid.
Rule two. Wave three can never be the shortest among waves one, three, and five. It does not have to be the longest, but it cannot be the shortest of the three.
Rule three. Wave four can never move into the price territory of wave one. In an uptrend, the low of wave four must stay above the high of wave one.
There is also a strong tendency worth watching. Wave five often shows divergence between price and momentum indicators such as volume, MACD, RSI, and Stochastic. Price makes a new high while the indicator makes a lower high, signaling that the strength behind the move is fading and a reversal may be near.
How to Trade Elliott Wave Theory
The cleanest opportunities come from trading in the direction of the impulsive waves, which are waves one, three, and five. Wave three in particular, given how often it becomes the strongest move, is the leg most traders want to be positioned for.
Because the rules define hard boundaries, they double as natural stop loss levels. In an uptrend, wave two usually does not fall below the end of wave one, so place your stop just below the low of wave one. In a downtrend the logic flips, so place your stop just above the high of wave one instead. Since wave four cannot overlap wave one, a position taken in anticipation of wave five can also use a stop near wave one. Finally, look for divergence at the start of an expected impulsive wave to confirm your entry with higher confidence.
A final note of caution. Elliott Wave Theory is subjective, and two skilled analysts can read the same chart differently, especially in choppy markets. Treat the wave structure as a framework for organizing what you see and defining your risk, not as a promise about what price will do next.
Ready to put it into practice? Trade on Millionero exchange.
This article is for educational purposes only and does not constitute financial or investment advice. Trading cryptocurrencies carries significant risk. Always do your own research before making any trading decision.