
The bullish crypto indicators have continued for the last few days, tilting Bitcoin’s trading patterns to the bulls’ advantage.
The resurgence of Bitcoin over the weekend has continued this week, with bullish crypto indicators taking over the market. BTC is also closing the gap between its trading level and 20-day moving average, which is a good sign. Bulls could take the cue to accumulate BTC if it surpasses the average. Moreover, its upward move also led to Bitcoin’s trading patterns turning buoyant.
The previous week, Bitcoin’s sell-offs had resulted in its trading range going below $57,000. At that crucial juncture, a few experts and analysts had warned of a decline to $50,000. Since the opposite has happened and BTC has marked a price rise, sentiments have also reversed to positive. Among other tokens, ETH also witnessed a price breakout at $3,100, with its market cap at over $378 billion.
On another optimistic note, the number of Bitcoin transactions has hit the one billionth mark. It achieved the feat after 15 years of its advent. Owing to its increasing popularity and use cases, the Bitcoin network is only set to grow further and hit new milestones in the near future. Meanwhile, the Ethereum network has processed more than two billion transactions to date.
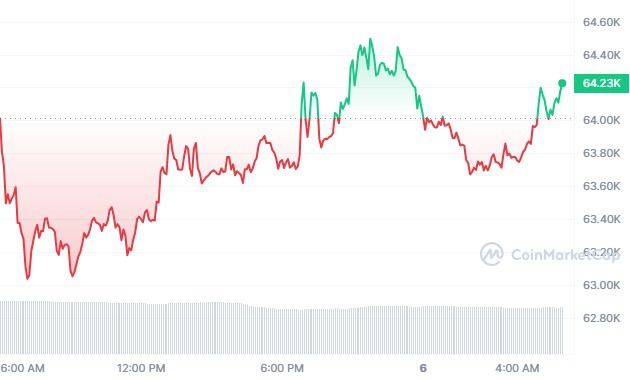
BTC/USD 1D price chart
Bitcoin is currently trading at around $64,200 on May 6, 2024, with BTC/USD trading higher by a margin of 1.21% in the last 24 hours. Bitcoin’s market cap was trading at around $ 1.26 trillion in the last 24 hours.
BTC/USD is trading below its 20-day EMA (64,300.17), as BTC’s 24-hour volume was at around $17 billion. The global crypto market cap increased by around 1.49%, trading above $2.37 trillion. BTC’s year-to-date returns are at 53.27%.
Join Millionero and start your journey with crypto trading!